The Journey of a Dotty Diagnostic
I was inspired by seeing the companion article Function reuse is just wishful thinking for Nicolas Rinaudo's talk, so I decided to do the same. This is meant to be a companion article for my talk, The Journey of a Dotty Diagnostic given at ScalaIO 2022 in Paris.
In this talk I dove into a few different areas exploring what actually makes up a diagnostic, how useful Scala diagnostics are, how a diagnostic actually gets from the compiler to your editor, and looked at what work is being done to improve this. Much of this was a learning experience for me, so come along for the ride.
- What actually makes up a diagnostic?
- The diagnostic usefulness scale
- How does the diagnostic actually get to your editor?
- Where is Scala on the scale?
- What else is on the scale?
- It's all about structure
- Why did you even look into this?
- What work is being done to improve this?
- What we could have
- What's keeping this from happening?
- Conclusion
What actually makes up a diagnostic?
Normally this would be the place I break down the reason for even caring about diagnostics, but before I give you the actual use-case that spurred me to go down this rabbit hole we need to go over the basics first and come to a common understanding of what even makes up a diagnostic. Trust me, going through this will make what's to come much clearer, so bear with me.
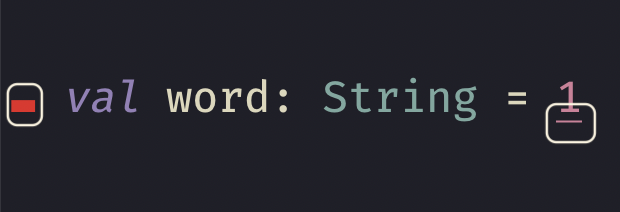
Let's start with a very minimal code example.
val word: String = 1
Now you don't need to know Scala well to know this won't work. If you're in your editor you'd expect to see something like this:
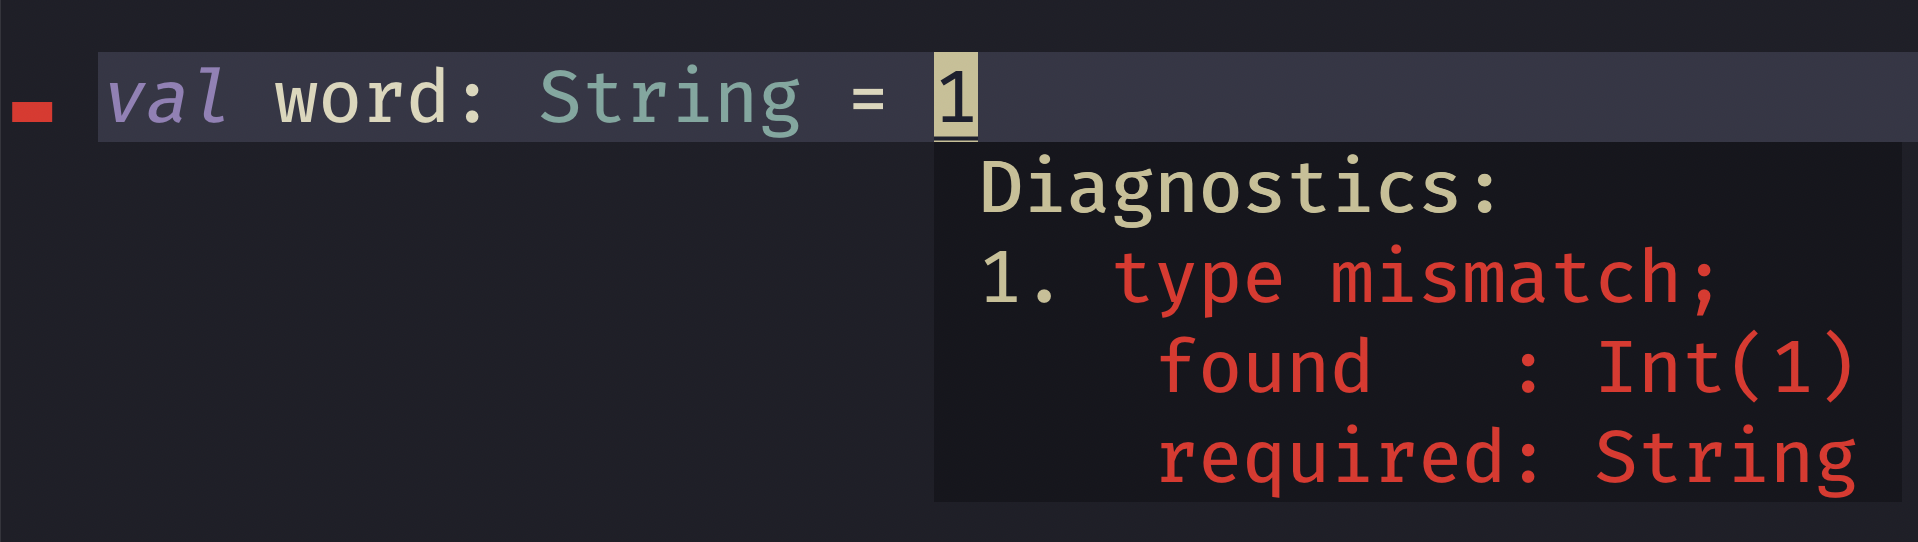
Probably what you'd expect, but let's break this a part a bit and look at the various parts.
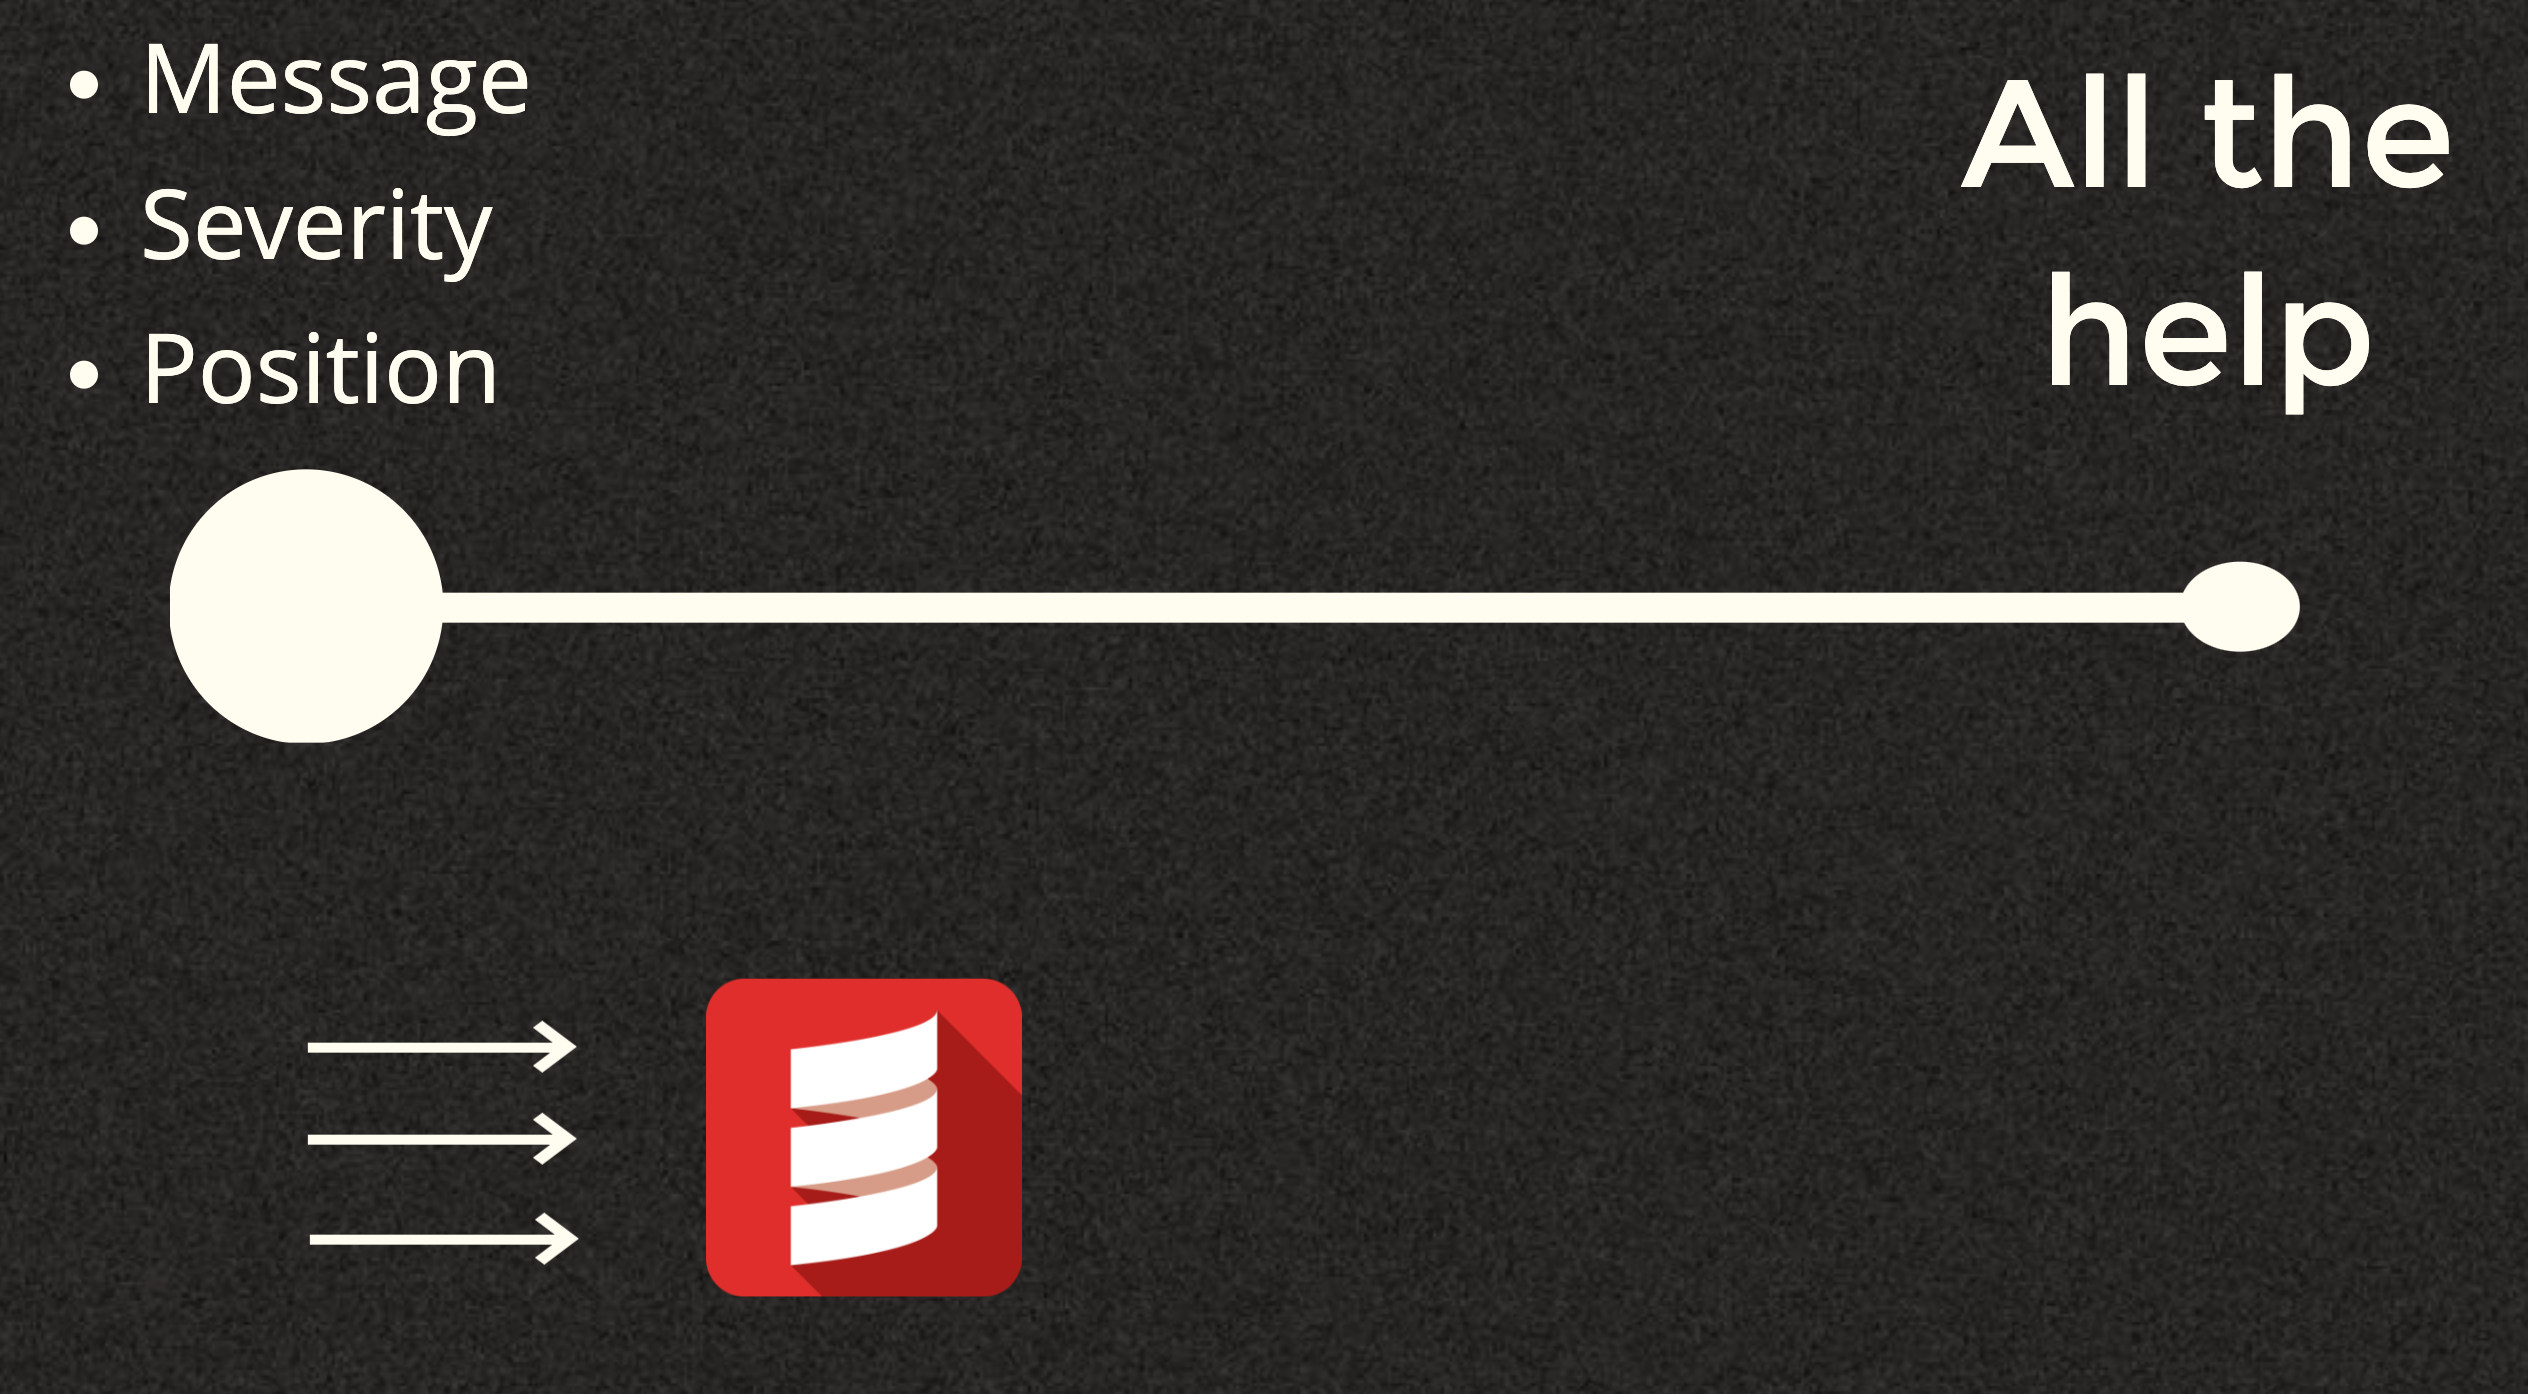
Firstly you have the message, which is what tells you what's actually wrong. This is typically front and center when you're viewing your diagnostic.
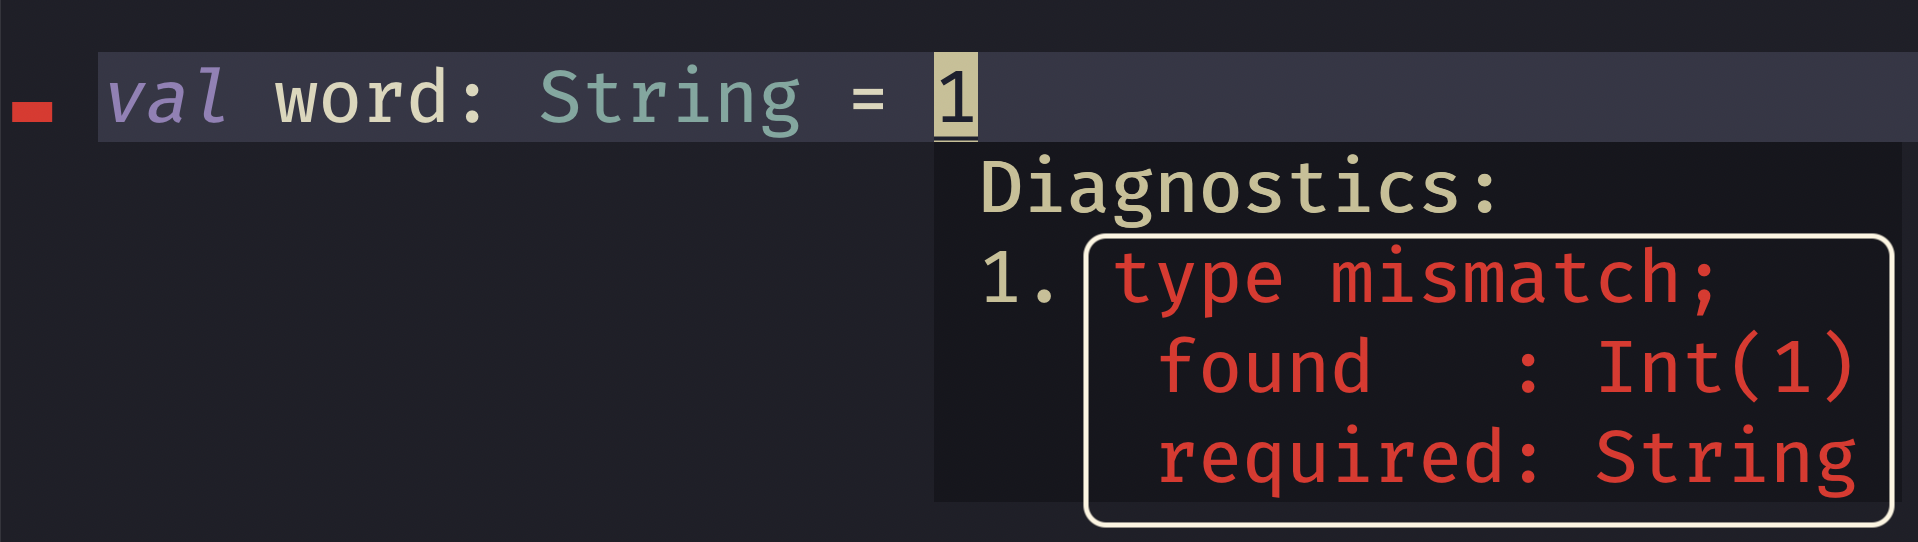
Secondly you have the severity level of your diagnostic. In our example here this an error, and that's indicated by the in your face red color. Typically you're message may be in this color along with something indicating where it is in your current file.
You're also probably familiar with the warning diagnostic, typically signified with a yellow/orange color as you can see here:
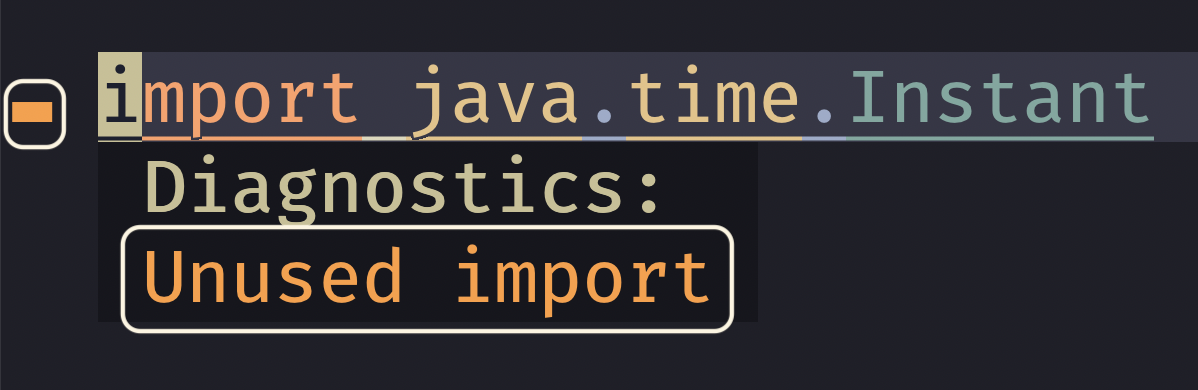
Now, some that you're probably less familiar with in Scala are info diagnostics.
You can see a great example of this in the quill library where you can
have a query and it will actually show you what's being generated. In this
case it's indicated in blue.
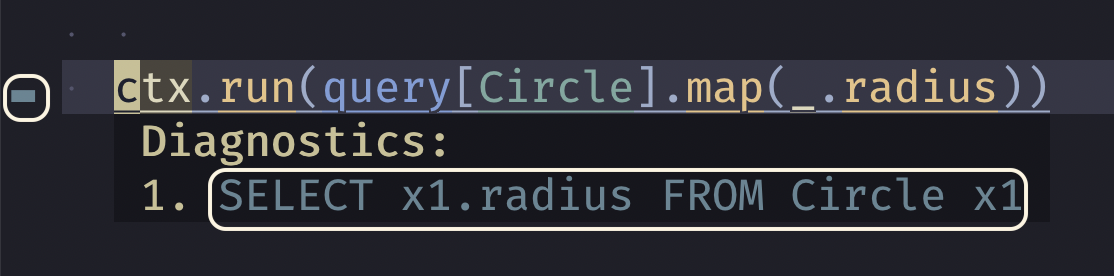
This is an incredibly useful type of diagnostic that isn't used much in the Scala ecosystem. There's also hint diagnostics, but as far as I know, there aren't used anywhere in the Scala ecosystem.
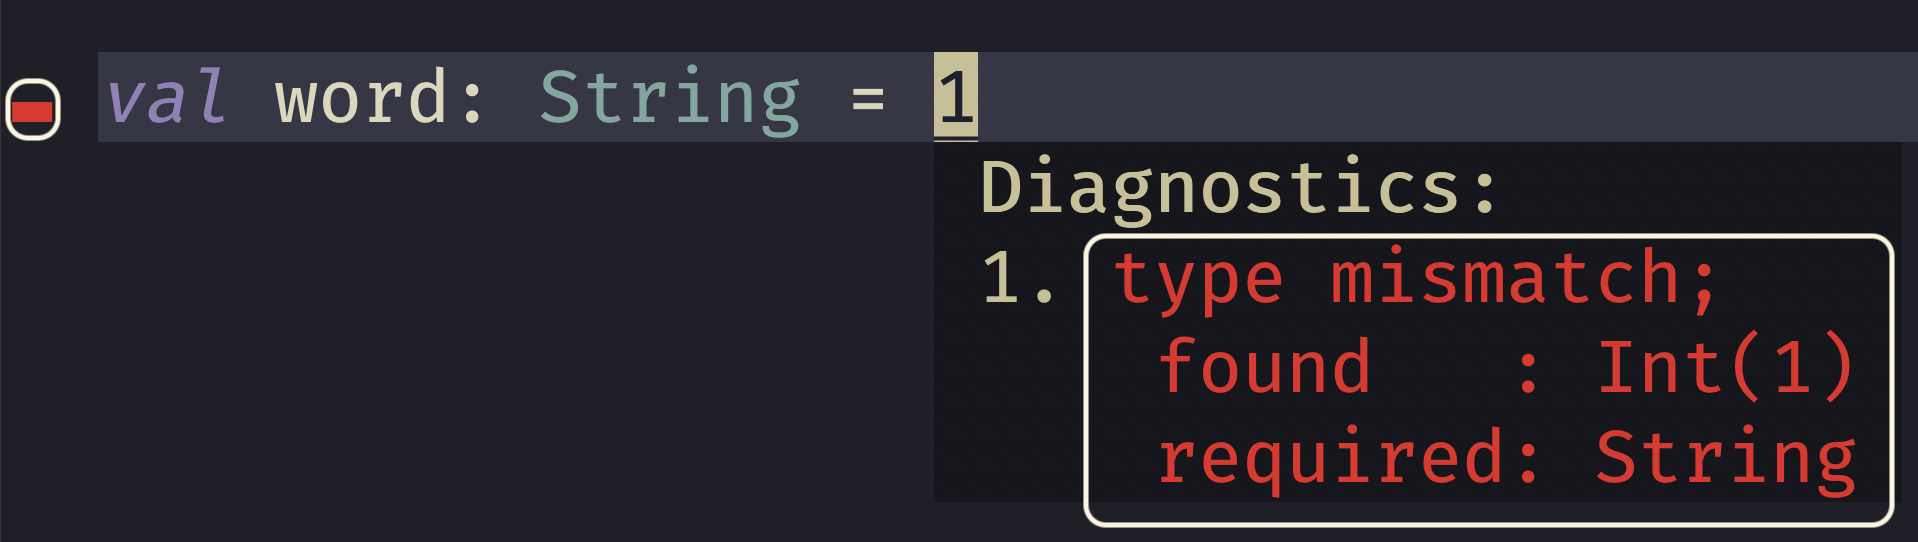
Thirdly we have the position it occurs in. This is typically a combination of marking the line number and the specific character or span that the error appears on.
These three things more or less make up the core parts of a diagnostic. Without one of these the diagnostic becomes quite a bit less useful.
The diagnostic usefulness scale
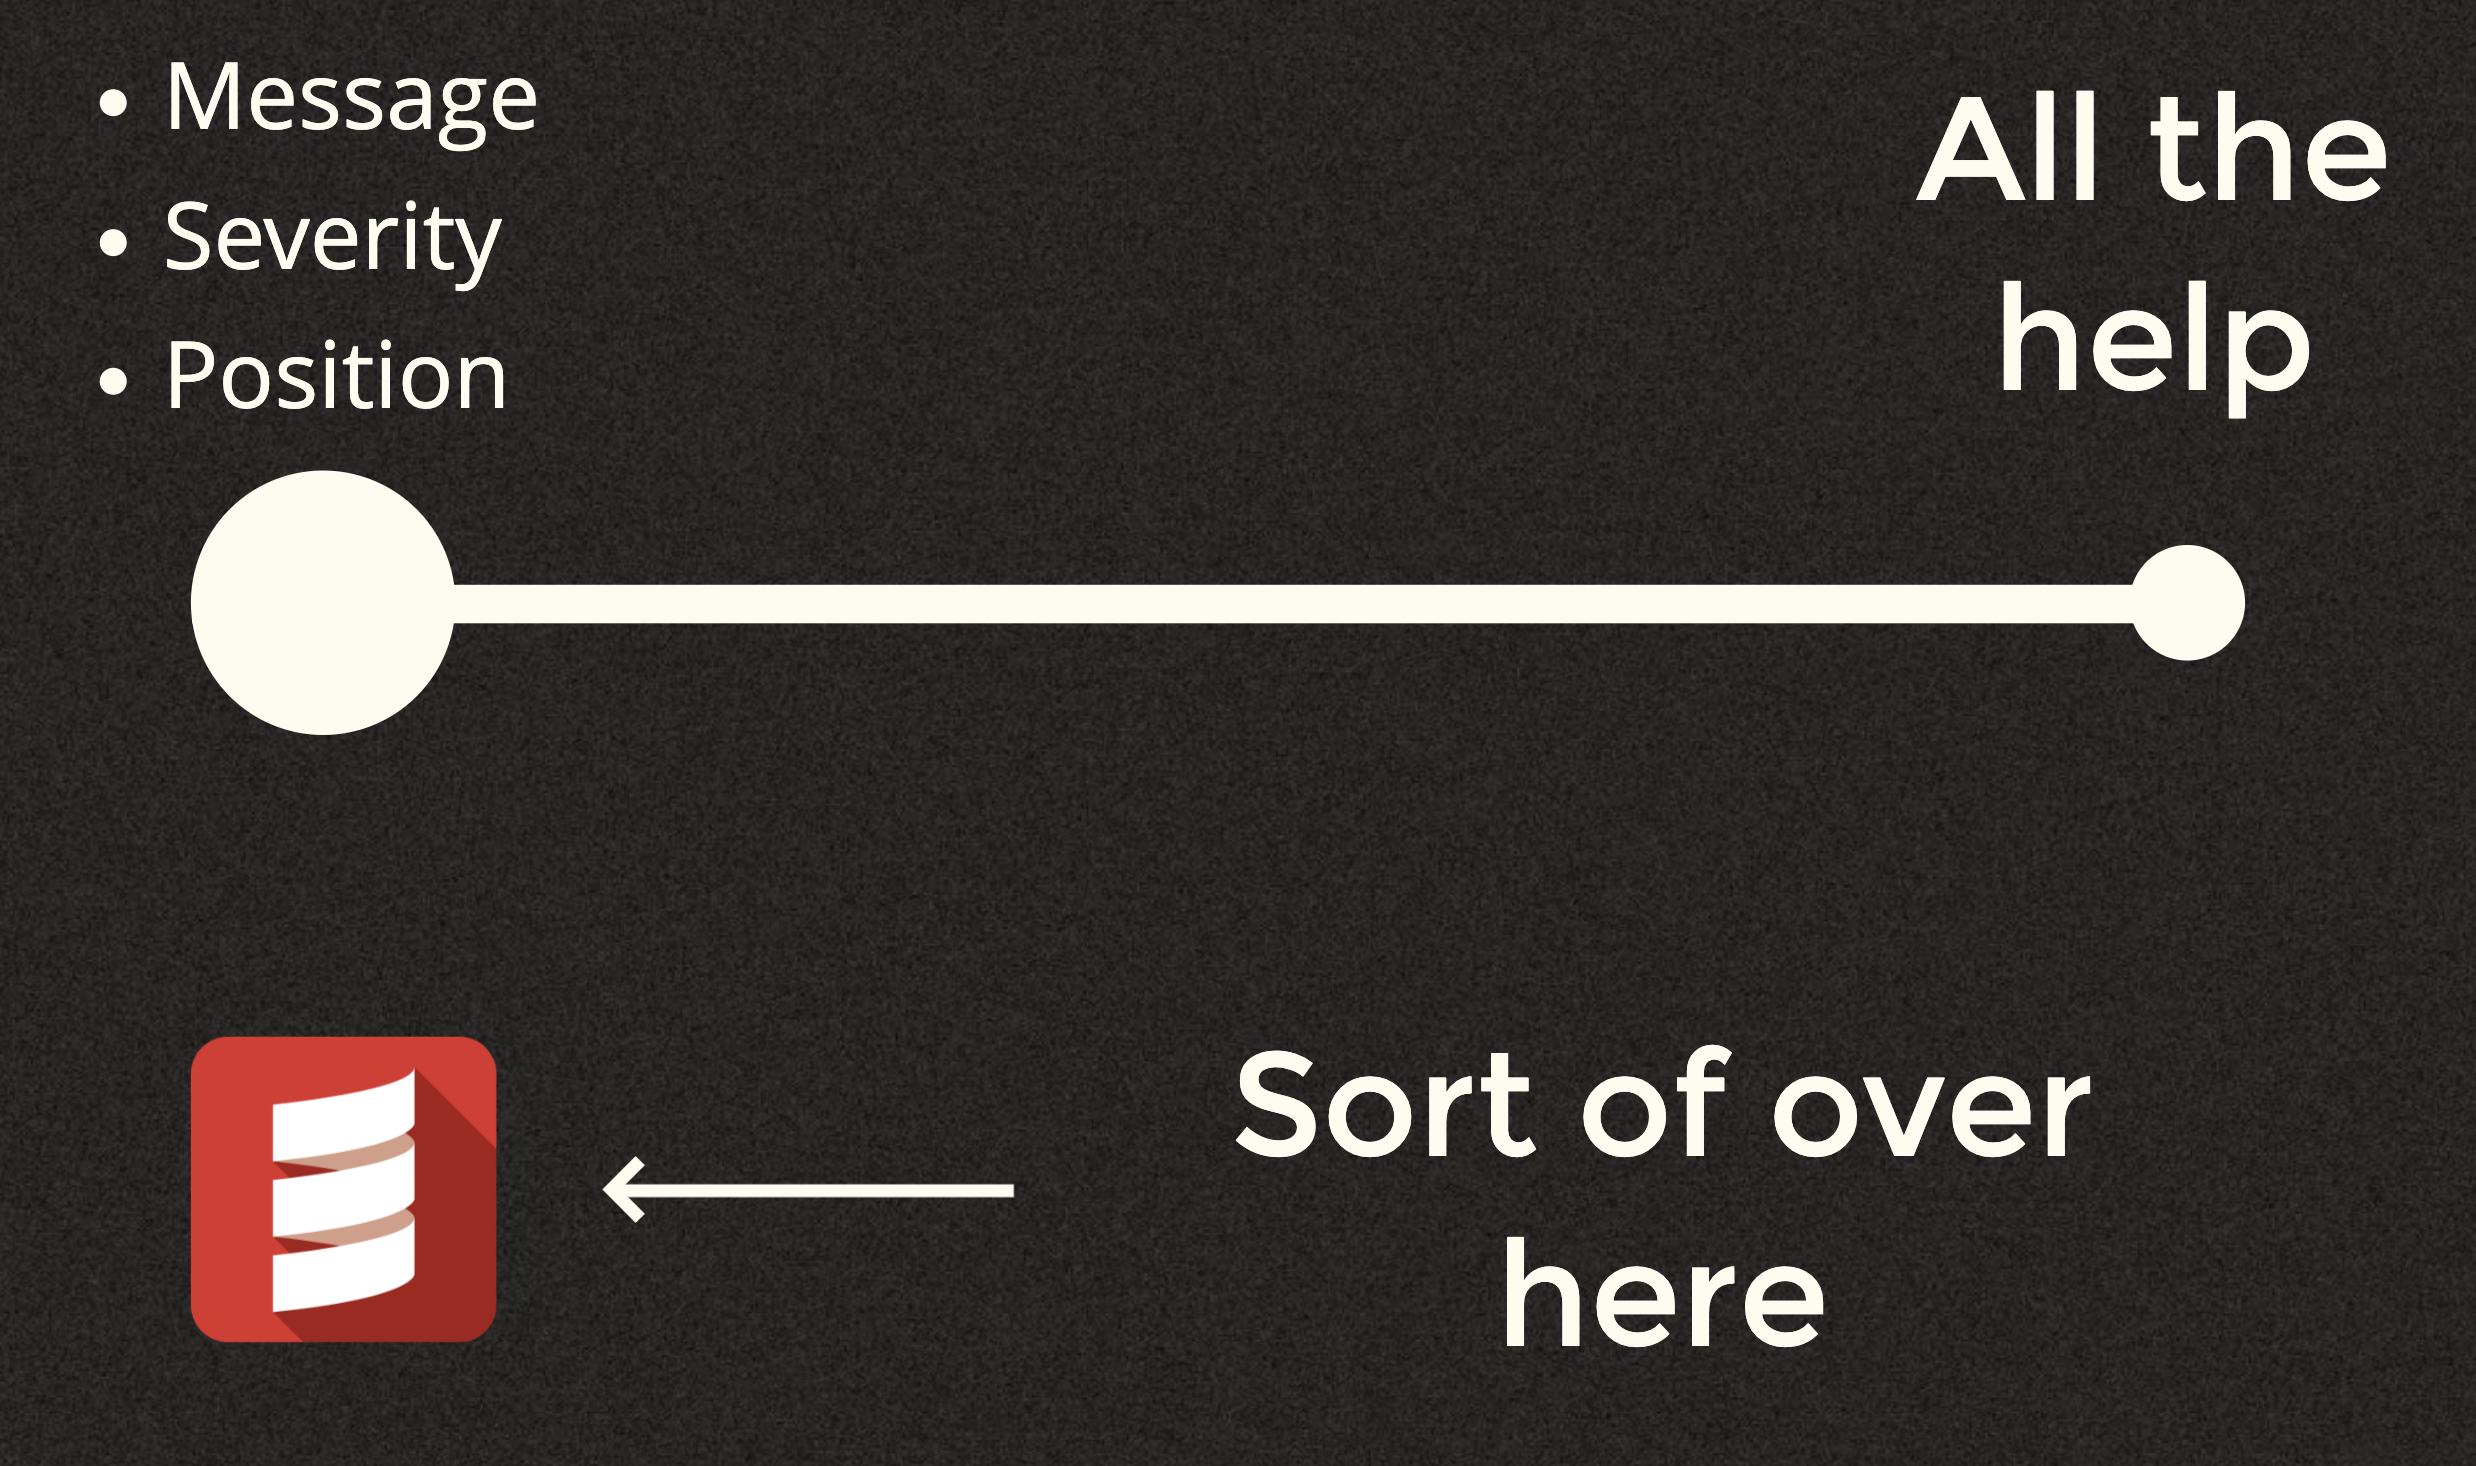
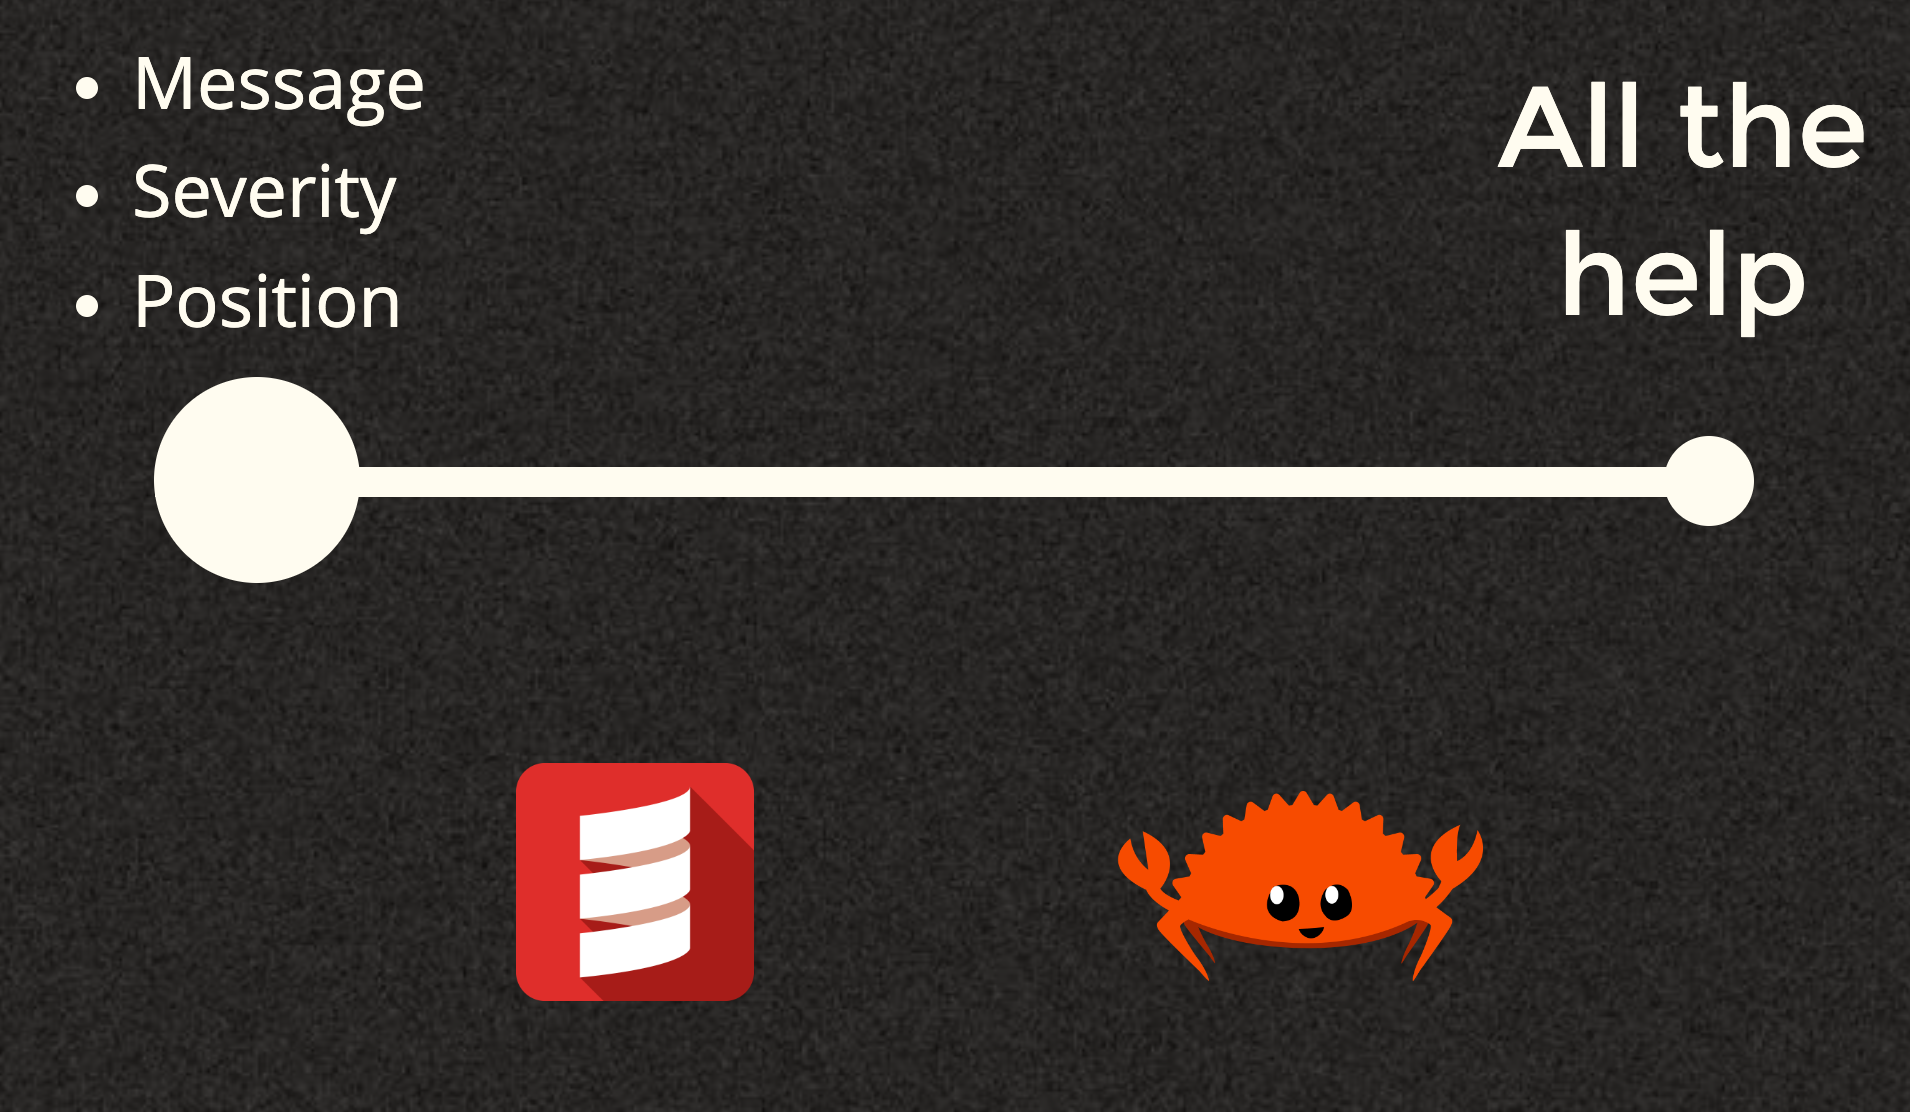
So now that we know the core parts of a diagnostic, let's create what I call The Diagnostic Usefulness Scale.
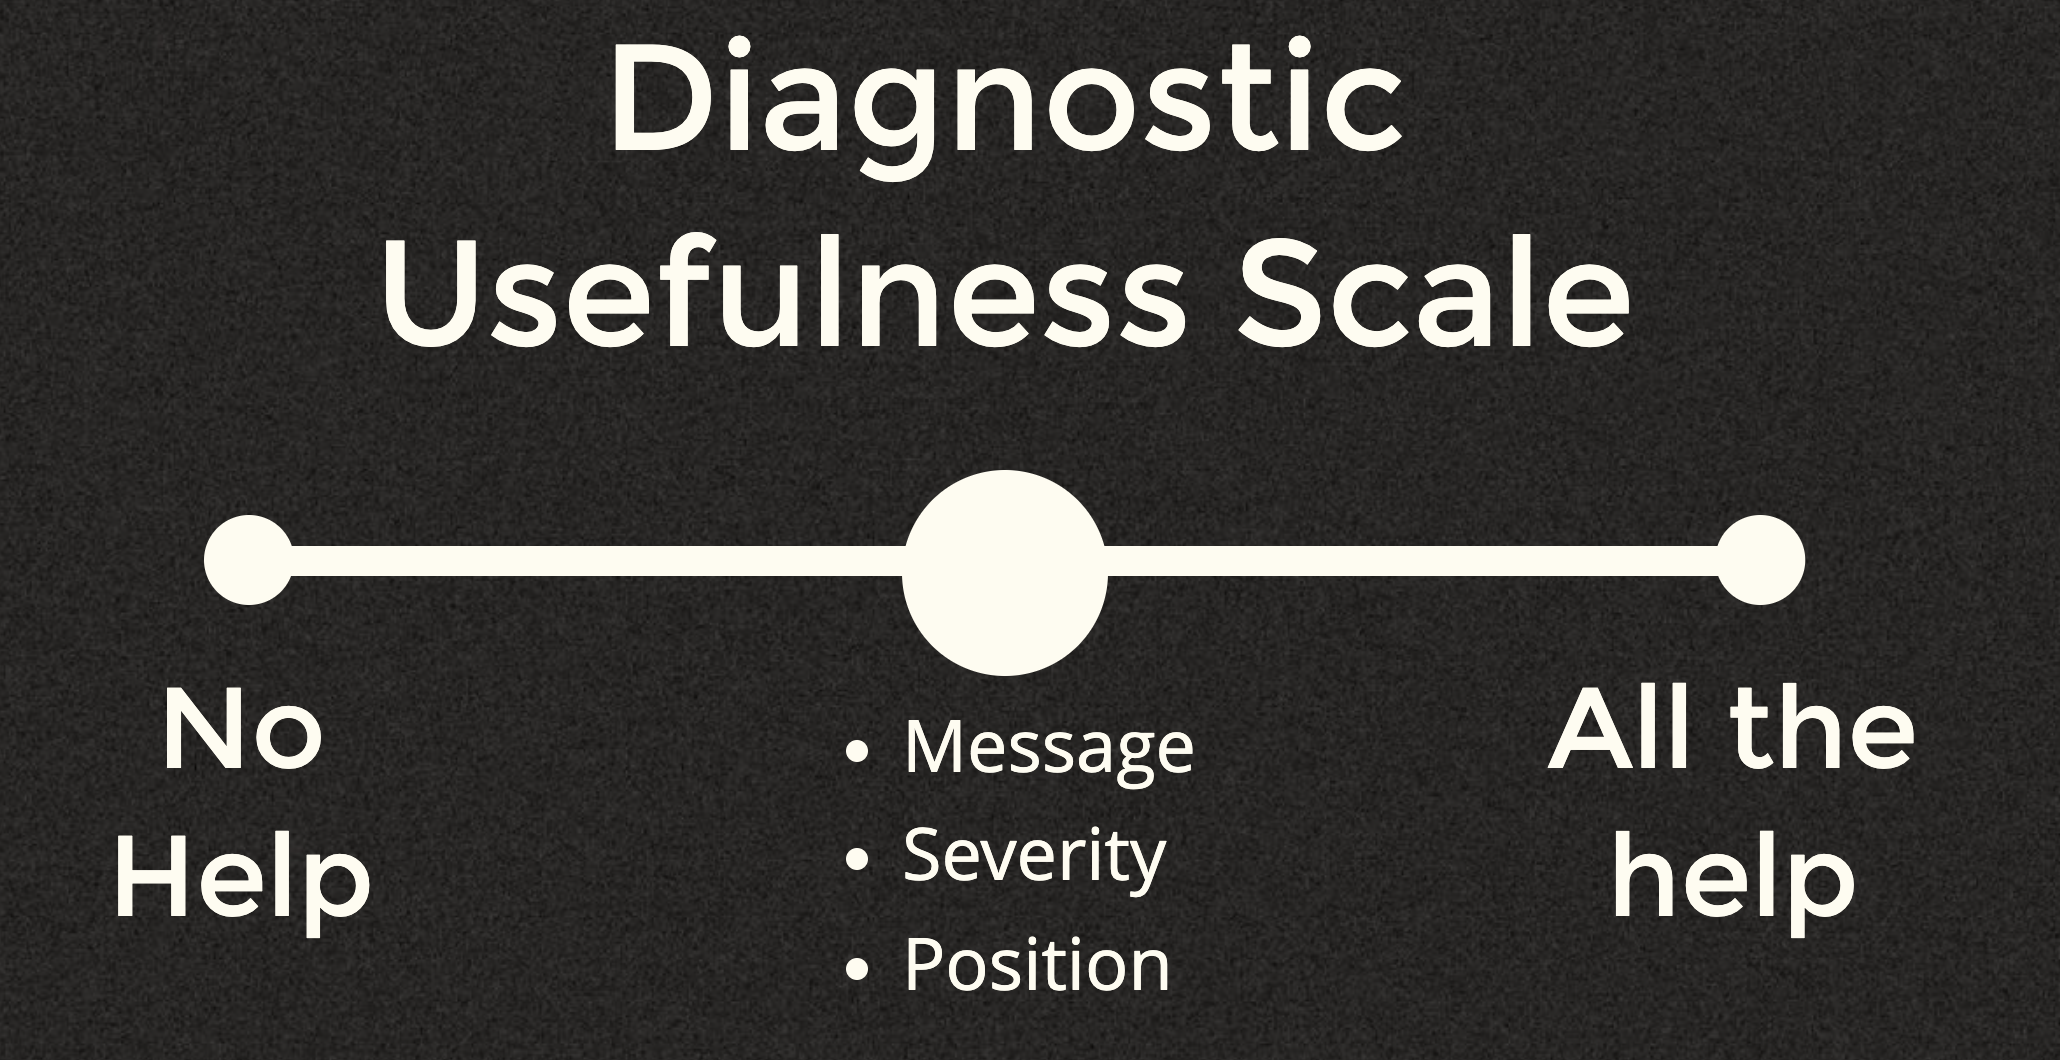
On the far left we have essentially no help at all, and on the far right we have all of the help. Since what we covered make up the core parts of a diagnostic let's just stick them in the middle. Realistically no useful language is going to report less than this. Not reporting any of them, especially the position or the message pretty much makes the diagnostic useless. So it's fair to say that in reality our scale really looks something like this:
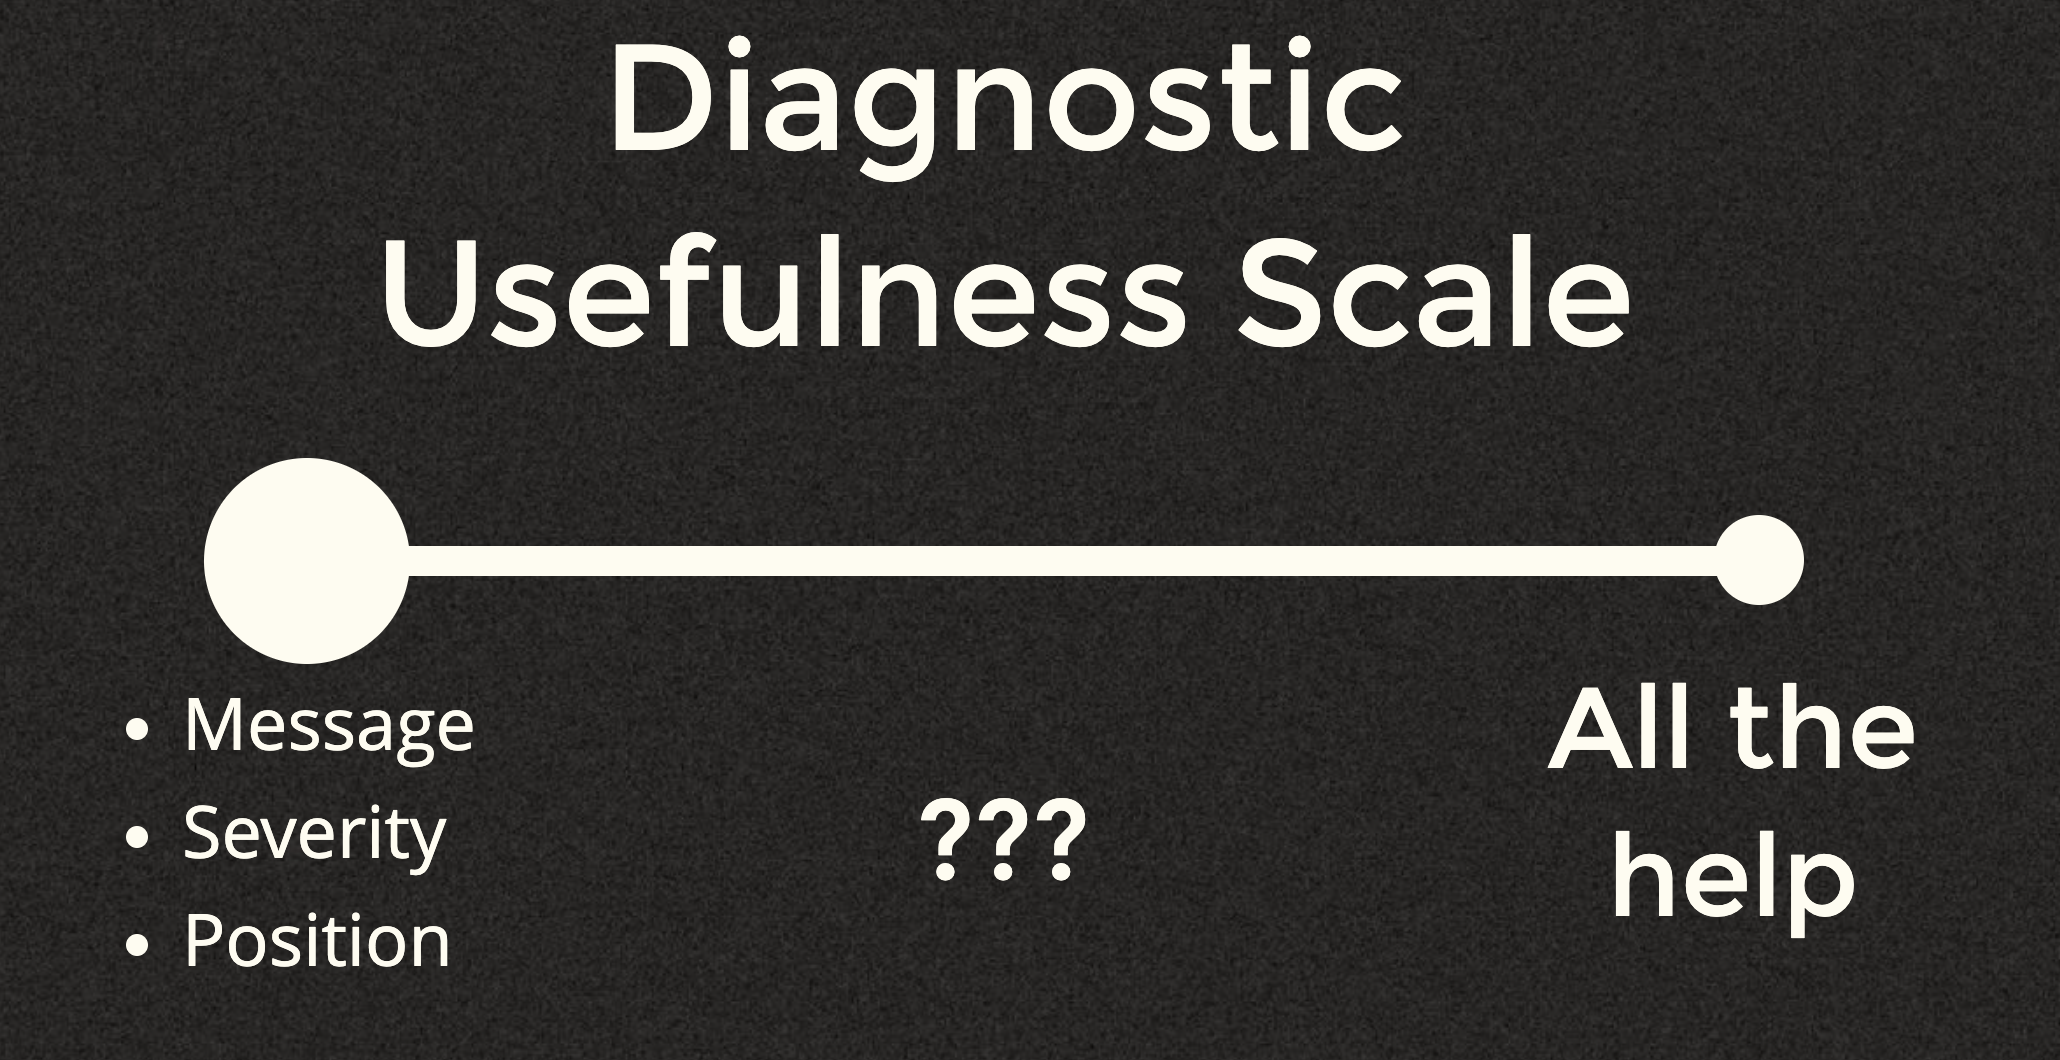
Since our core parts now move all the way over to the left you're hopefully focusing on the big area in the middle. I'd like to take a look at three questions based off this.
- Where is Scala on this scale?
- What else is on this scale?
- Where are other languages on this scale?
How does the diagnostic actually get to your editor?
So before we can really dive into where Scala exactly is on this scale we need to take a deeper look at both the actual structure of a diagnostic inside of Dotty and also the journey it takes from the compiler all the way to your editor. It's also important to realize that the way a diagnostic is reported wildly depends on quite a few things:
- Are you in the REPL?
- Are you using X build tool?
- Are you using a build server?
- Are you using IntelliJ? Metals? Ensime?
- Or some combination of the above?
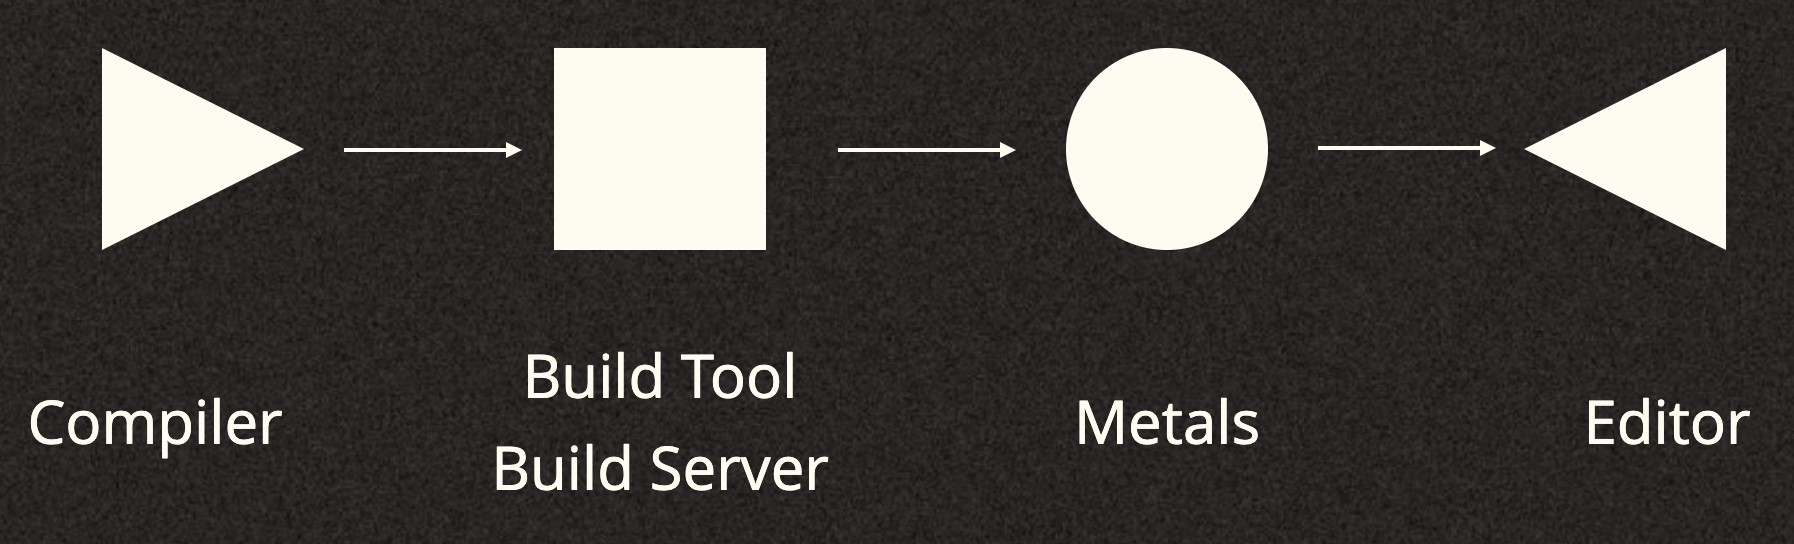
For the purpose of this article we'll pretend that we have the below tool-chain:
We'll start in the compiler and we'll take a look at some places we actually do
some reporting. First we'll look here in Checking.scala:
if (param.is(Erased))
  report.error("value class first parameter cannot be `erased`", param.srcPos)
else
  for (p <- params if !p.is(Erased))
    report.error("value class can only have one non `erased` parameter", p.srcPos)
Notice how it's just reporting a string and a position. That's it. It's a super
quick way to report an error and looking around the Dotty code base I'd say this
is the most common way I see errors reported. There are instances however that
Messages are reported as well. You can see an example here in
Checking.scala:
def fail(msg: Message) = report.error(msg, sym.srcPos)

def checkWithDeferred(flag: FlagSet) =
  if (sym.isOneOf(flag))
    fail(AbstractMemberMayNotHaveModifier(sym, flag))
You can see what
AbstractMemberMayNotHaveModifier
looks like, but it's one of many Messages that Scala has. Here's what the
Message class looks like:
abstract class Message(val errorId: ErrorMessageID) { self =>

  protected def msg: String

  def kind: MessageKind

  protected def explain: String

  protected def msgSuffix: String = ""

  def canExplain: Boolean = explain.nonEmpty

  private var myMsg: String | Null = null
  private var myIsNonSensical: Boolean = false

  private def dropNonSensical(msg: String): String = {...}

  def rawMessage = message

  @threadUnsafe lazy val message: String = dropNonSensical(msg + msgSuffix)

  @threadUnsafe lazy val explanation: String = dropNonSensical(explain)

  def isNonSensical: Boolean = { message; myIsNonSensical }

  def persist: Message = {...}

  def append(suffix: => String): Message = mapMsg(_ ++ suffix)

  def mapMsg(f: String => String): Message = {...}

  def appendExplanation(suffix: => String): Message = {...}

  def showAlways = false

  override def toString = msg
}
I've taken out all the comments to shorten up the snippet, but you should get the idea. Pretty much everything inside of here is focused around the message of the diagnostic that you end up seeing as an end user.
Now let's take a look at how an actual Diagnostic is
structured in Dotty.
class Diagnostic(
  val msg: Message,
  val pos: SourcePosition,
  val level: Int
) extends Exception with interfaces.Diagnostic:
  private var verbose: Boolean = false
  def isVerbose: Boolean = verbose
  def setVerbose(): this.type =
    verbose = true
    this

  override def position: Optional[interfaces.SourcePosition] =
    if (pos.exists && pos.source.exists) Optional.of(pos) else Optional.empty()

  override def message: String =
    msg.message.replaceAll("\u001B\\[[;\\d]*m", "")

  override def toString: String = s"$getClass at $pos: $message"
  override def getMessage(): String = message
end Diagnostic
Notice how the Diagnostic actually holds the Message and then you also see
the other main parts that we talked about earlier with the pos and the
level. So right here we again have the core parts of a diagnostic.
Now already at this point the way this move forwards depends on the reporter. Basically you could look at it in one of two ways:
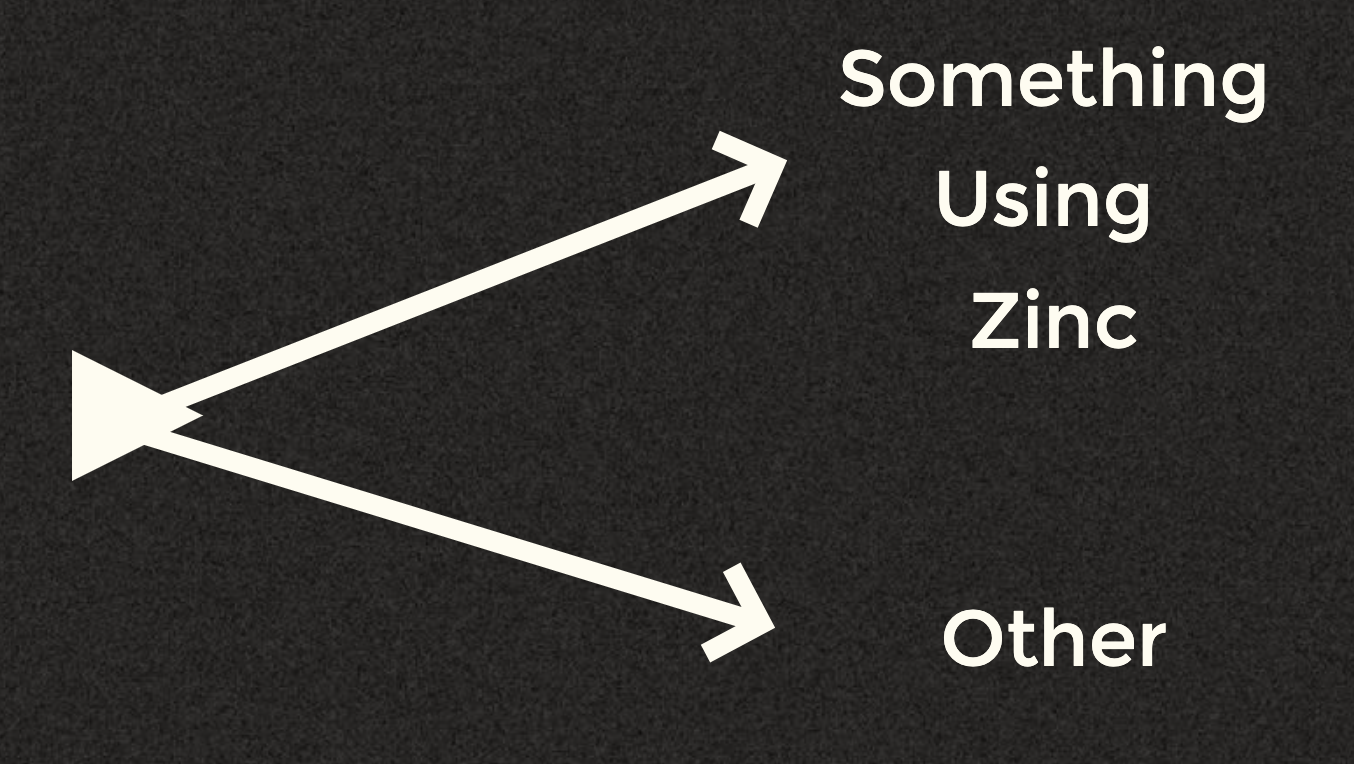
Well why Zinc? Where does Zinc come into the picture? If you look into
the Dotty codebase you'll notice a directory, sbt-bridge:
❯ tree -L 5 sbt-bridge/
sbt-bridge
├── resources
│  └── META-INF
│     └── services
│        └── xsbti.compile.CompilerInterface2
└── src
   ├── dotty
   │  └── tools
   │     └── xsbt
   │        ├── CompilerBridge.java
   │        ├── CompilerBridgeDriver.java
   │        ├── DelegatingReporter.java
   │        ├── DiagnosticCode.java
   │        ├── InterfaceCompileFailed.java
   │        ├── PositionBridge.java
   │        ├── Problem.java
   │        ├── ZincPlainFile.java
   │        └── ZincVirtualFile.java
   └── xsbt
      ├── CachedCompilerImpl.java
      ├── CompilerClassLoader.java
      ├── CompilerInterface.java
      ├── ConsoleInterface.java
      ├── DottydocRunner.java
      └── ScaladocInterface.java
Well what is this? If you look into the Zinc README.md you'll see the
following note:
The compiler bridge classes are loaded using java.util.ServiceLoader. In other words, the class implementing xsbti.compile.CompilerInterface2 must be mentioned in a file named: /META-INF/services/xsbti.compile.CompilerInterface2.
And that's exactly what we're seeing here. The Dotty codebase actually
implements ComplerInterface2 so that anything using Zinc can basically
communicate with Dotty. The xsbt directory is for the legacy version of Zinc,
but the dotty.tools.xsbt is the new one that we're concerned about. So if we
have a Diagnostic in Dotty we need to look at how this is represented as it
starts flowing and being reported through this bridge. To do that we need to take
yet another step back and look at the interfaces where this all starts. These
interfaces are actually a module in the sbt codebase called
util-interface. In there you can find Problem.java.
That Problem looks like this:
public interface Problem {
  String category();

  Severity severity();

  String message();

  Position position();

  // Default value to avoid breaking binary compatibility
  /**
   * If present, the string shown to the user when displaying this Problem. Otherwise, the Problem
   * will be shown in an implementation-defined way based on the values of its other fields.
   */
  default Optional<String> rendered() {
    return Optional.empty();
  }
}
Again, we'll notice the core parts of what we talked about earlier, the
message, the position, and the severity level. We do have a couple extras here,
the category and more importantly rendered(). Note that rendered here will be
important when we talk about some extra information that Dotty shows when
running your code in a REPL or through your build tool, but not through BSP.
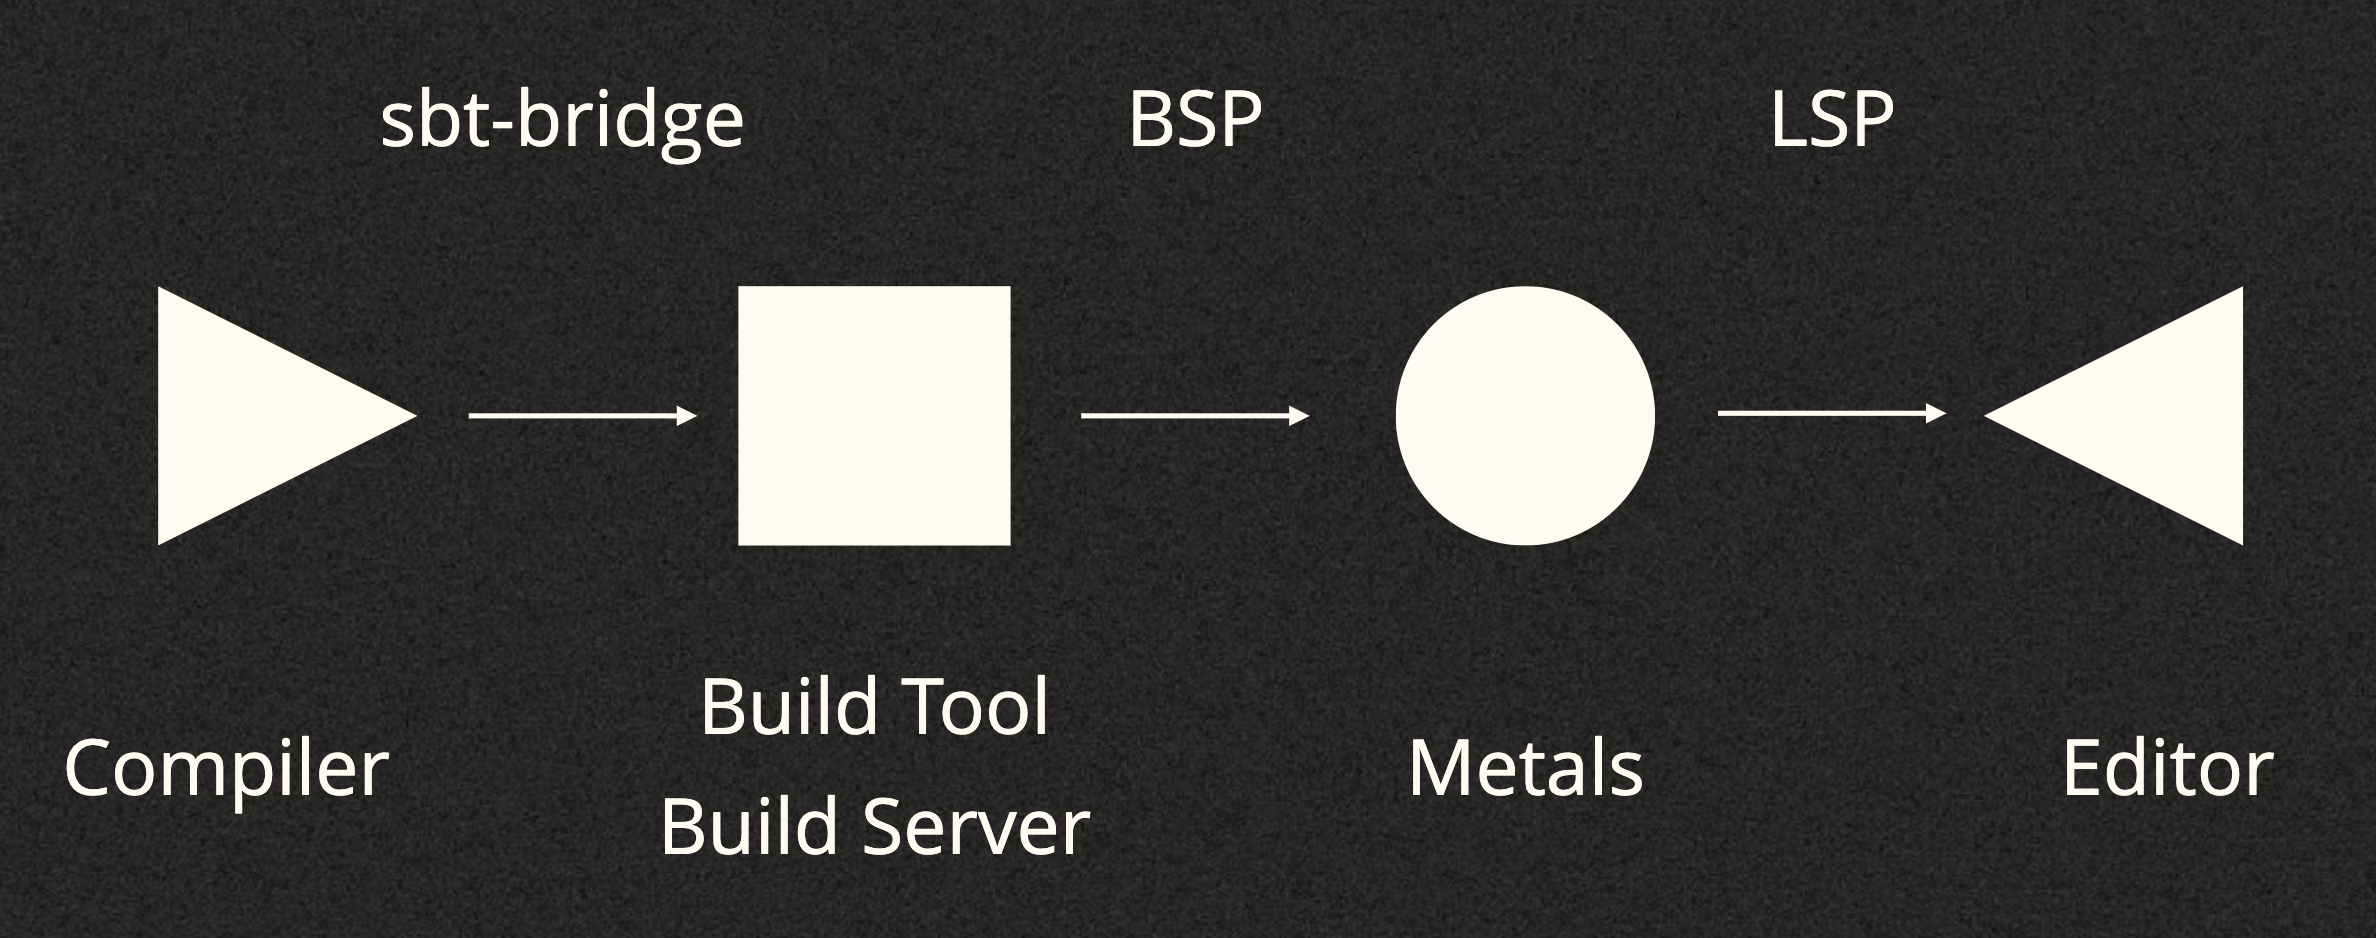
There is a difference. If we look back at the little flow chain graph that we
said we're following we can actually label the arrows for each "protocol" or
"interface" that is defining how these things are being transferred. When
labeled it looks like this:
So we know what Problem looks like when it's passing through the sbt-bridge,
which leaves us looking at what it looks like in the Language Server Protocol
(LSP) and the Build Server Protocol (BSP). BSP was modeled after LSP so
the Diagnostic in BSP should be a replica of what's in LSP. Here's what it
looks like in LSP:
export interface Diagnostic {
	/** The range at which the message applies.*/
	range: Range;
	/**
	 * The diagnostic's severity. Can be omitted. If omitted it is up to the
	 * client to interpret diagnostics as error, warning, info or hint.
	 */
	severity?: DiagnosticSeverity;
	/** The diagnostic's code, which might appear in the user interface. */
	code?: integer | string;
	/** An optional property to describe the error code. */
	codeDescription?: CodeDescription;
	/**
	 * A human-readable string describing the source of this
	 * diagnostic, e.g. 'typescript' or 'super lint'.
	 */
	source?: string;
	/** The diagnostic's message. */
	message: string;
	/** Additional metadata about the diagnostic. */
	tags?: DiagnosticTag[];
	/**
	 * An array of related diagnostic information, e.g. when symbol-names within
	 * a scope collide all definitions can be marked via this property.
	 */
	relatedInformation?: DiagnosticRelatedInformation[];
	/**
	 * A data entry field that is preserved between a
	 * `textDocument/publishDiagnostics` notification and
	 * `textDocument/codeAction` request.
	 */
	data?: unknown;
}
At this point you should be able to assume exactly what I'm about to say. We
again have the main things we looked at before with the range, severity, and
the message. However we're now introduced to some new things we haven't really
seen yet. We'll dig into these further later but take note of the code,
relatedInformation and data fields.
Let's pretend we're using sbt now as our Build server. After the Dotty
Diagnostic has been reported via the bridge and is being represented as a
Problem internally for sbt it needs to then be reported over BSP. This means
it again it gets translated, this time into the BSP Diagnostic. You can see
this happen here in the BuildServerReporter.scala:
protected override def publishDiagnostic(problem: Problem): Unit = {
  for {
  id <- problem.position.sourcePath.toOption
  diagnostic <- toDiagnostic(problem)
  filePath <- toSafePath(VirtualFileRef.of(id))
} {
  problemsByFile(filePath) = problemsByFile.getOrElse(filePath, Vector.empty) :+ diagnostic
  val params = PublishDiagnosticsParams(
    TextDocumentIdentifier(filePath.toUri),
    buildTarget,
    originId = None,
    Vector(diagnostic),
    reset = false
  )
  exchange.notifyEvent("build/publishDiagnostics", params)
}
Notice the last line where the build/publishDiagnostics event is being
emitted. This is how sbt as a build server is sending the diagnostics to
whatever client is current attached. In our example this client is Metals. Once
Metals receives it it will do a few things, like possibly some de-duplication,
but you'll then see it turn the BSP diagnostic into an LSP one
here:
private def publishDiagnostics(
    path: AbsolutePath,
    queue: ju.Queue[Diagnostic],
): Unit = {
  if (!path.isFile) return didDelete(path)
  val current = path.toInputFromBuffers(buffers)
  val snapshot = snapshots.getOrElse(path, current)
  val edit = TokenEditDistance(
    snapshot,
    current,
    trees,
    doNothingWhenUnchanged = false,
  )
  val uri = path.toURI.toString
  val all = new ju.ArrayList[Diagnostic](queue.size() + 1)
  for {
    diagnostic <- queue.asScala
    freshDiagnostic <- toFreshDiagnostic(edit, diagnostic, snapshot)
  } {
    all.add(freshDiagnostic)
  }
  // Removed some de-duplication stuff here to save room
  languageClient.publishDiagnostics(new PublishDiagnosticsParams(uri, all))
}
Finally, the last line you see Metals publishing this diagnostic to the language client, which in our case is your editor. So as you can see, the journey from the compiler actually reporting the error goes through quite a few places and representations before it actually hits your eyes.
Where is Scala on the Scale
Now that we've seen the structure of the actual Scala diagnostic coming from the compiler we can sort of gauge where Scala is at on our diagnostic usefulness scale. I'd probably put it around here:
But hold on a second. Maybe this isn't fair as there are a few extra things that Scala 3 does. Let's take a look at these. We'll take a simple piece of Scala code that as you know, won't work:
trait Foo:
  def hello(): Unit
  def goodBye(): Unit

class Greeting extends Foo
We'll use scala-cli and run this snippet. You'll see the
following output:
Compiling project (Scala 3.2.0, JVM)
[error] ./demo.scala:5:7: class Greeting needs to be abstract, since:
[error] it has 2 unimplemented members.
[error] /** As seen from class Greeting, the missing signatures are as follows.
[error]  *  For convenience, these are usable as stub implementations.
[error]  */
[error]   def goodBye(): Unit = ???
[error]   def hello(): Unit = ???
[error] class Greeting extends Foo
[error]       ^
Error compiling project (Scala 3.2.0, JVM)
Notice that the error message actually has stub implementations that you could copy and paste into your code to make the code compile. This is a helpful little message.
Let's look at another one:
trait Foo[A]:
  def foo: Int

def foo =
  second[String]

inline def first[A]: Int =
  compiletime.summonInline[Foo[A]].foo

inline def second[A]: Int =
  first[A] + 1
This one is a bit more interesting and we'll show the error it produces in a few different ways. Firstly, in your editor you'll just see:
No given instance of type Foo[String] was found
Same if you run it with scala-cli:
Compiling project (Scala 3.2.0, JVM)
[error] ./demo.scala:5:3: No given instance of type Foo[String] was found
[error]   second[String]
[error]   ^^^^^^^^^^^^^^
Error compiling project (Scala 3.2.0, JVM)
Compilation failed
But now notice the difference if you run it with scala directly, sbt, or Mill:
-- Error: /Users/ckipp/Documents/scala-workspace/scripts/demo.scala:5:8 --------
 5 |  second[String]
   |  ^^^^^^^^^^^^^^
   |  No given instance of type Foo[String] was found
   |----------------------------------------------------------------------------
   |Inline stack trace
   |- - - - - - - - - - - - - - - - - - - - - - - - - - - - - - - - - - - - - -
   |This location contains code that was inlined from demo.scala:8
 8 |  compiletime.summonInline[Foo[A]].foo
   |  ^^^^^^^^^^^^^^^^^^^^^^^^^^^^^^^^
   |- - - - - - - - - - - - - - - - - - - - - - - - - - - - - - - - - - - - - -
   |This location contains code that was inlined from demo.scala:8
11 |  first[A] + 1
   |  ^^^^^^^^
    ----------------------------------------------------------------------------
1 error found
Errors encountered during compilation
Now we get some extra information about the inlined code and where that inline code
is located. This is a very simple example, but imagine a much larger code base.
This could be incredibly useful! The difference here is whether or not the
report is using the rendered() method to get the diagnostic message or just
grabbing the actual message.
So with this new information maybe it's a bit fair to bump Scala over a bit on our Diagnostic Usefulness Scale:
What else is on the scale?
At this point you're probably starting to wonder what else is actually on this scale? What other languages have more to offer than what we're seeing. In order to explore this we'll again dive into a small code sample. We'll start with Scala:
object Main:
  val greeting = "hello"

  greeting = "hi"
I'm using this snippet both for its brevity but also because as minimal as it is, it'll show exactly what we want. Let's look at what we get using VS Code with Metals for this diagnostic:
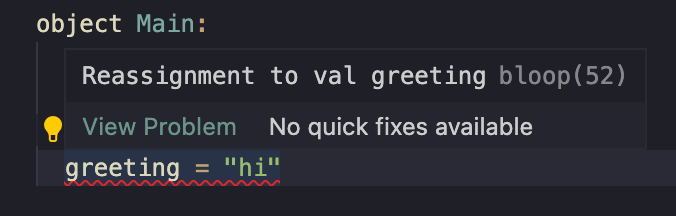
This of course tells you the issue, but if you're like me you might be asking a few more questions when looking at this diagnostic:
- Where is the original assignment?
- Can I get a more detailed explanation of this error?
- What are my alternatives to fix this?
None of these questions are really answered by this diagnostic. But let's take a look at another language. We'll use Rust with essentially the same snippet:
fn main() {

    let greeting = "hello";

    greeting = "hi";

}
In your editor (using VS Code again) you'll see the following:
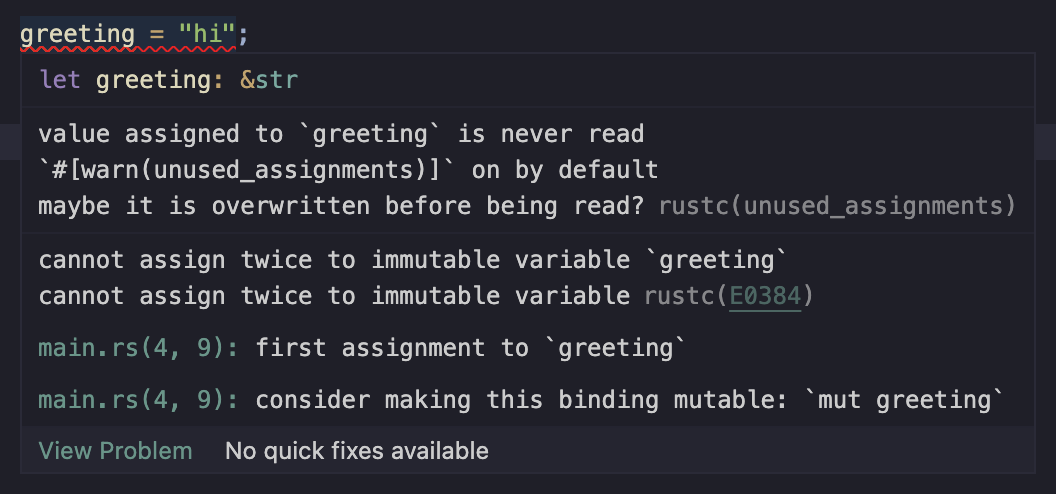
Now let's revising those questions we had earlier. Firstly, Where is the original assignment? Notice that this is actually included in the Rust diagnostic:
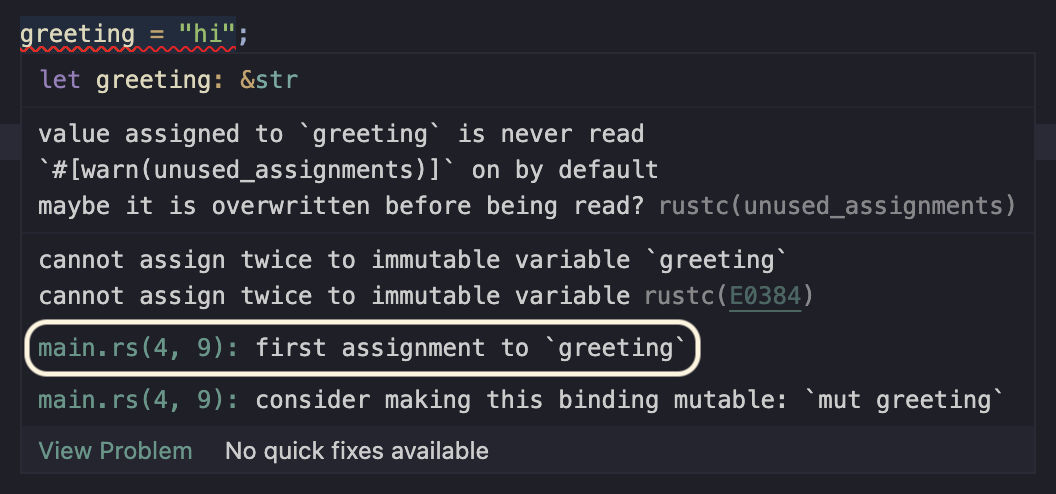
That's pretty cool. Not only does it tell me, but I can just click and jump to it. Perfect. Again, this is a tiny example, but imagine if this was a huge code base. What about the next question, Can I get a more detailed explanation of this error?
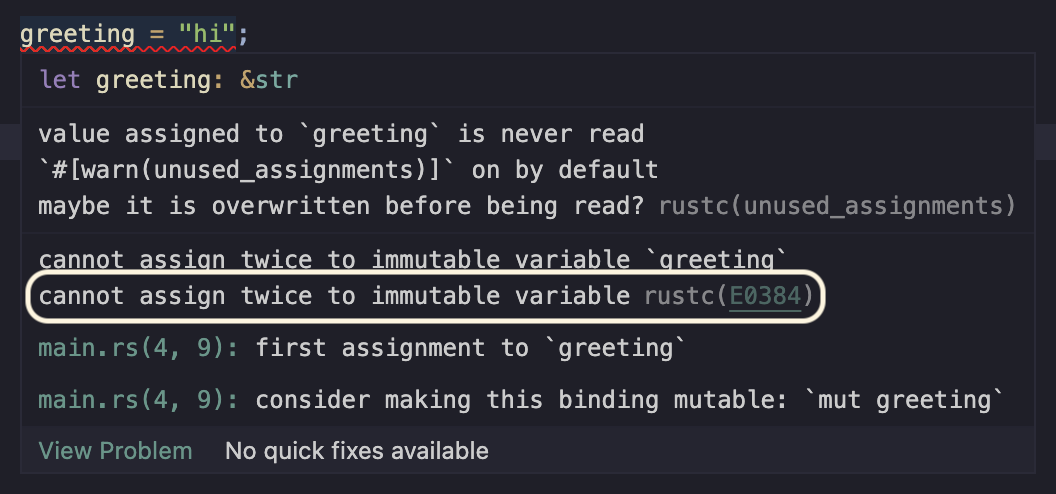
So there is a short error message which is pretty clear, but notice the E0384
here. What is this? It's also at this point that I'm curious if you've ever
noticed this in Scala. When running your code have you ever seen the following:
-- [E003] Syntax Deprecation Warning: examples/003_DeprecatedWithOperatorID.scala:4:18
4 |  type A = Double with Int
  |                  ^
  |                with as a type operator has been deprecated; use & instead
1 warning found
Notice the [E003] here. I'm going to guess that most people just gloss right
over this, but it's actually important... but unused. In Scala 3 some
diagnostics have a unique ID attached to them. In this case usage of with is
deprecated and the unique ID signifying that is 003. Well where is 003
documented? It's not. It's also not used literally anywhere at the moment in the
Scala ecosystem (as far as I know). But let's look at how it is used in Rust.
In the Rust diagnostic this is actually a clickable link that will bring you to
the Rust error codes index. If we click on E0384 we're
brought to a section with a more detailed explanation of the error message and a
runnable code snippet to reproduce it. Again, this is a simple error that we've
chosen, but imagine if this was a more involved error message that might be hard
for users to understand. Think of newcomers to a language that might not be
familiar with all the lingo and concepts a language has to offer. How incredibly
useful this could be. There currently is no official thing like this for Scala.
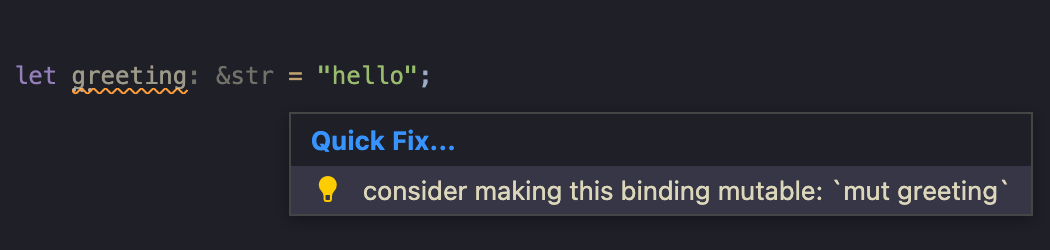
The final question we asked was, What are my alternatives?
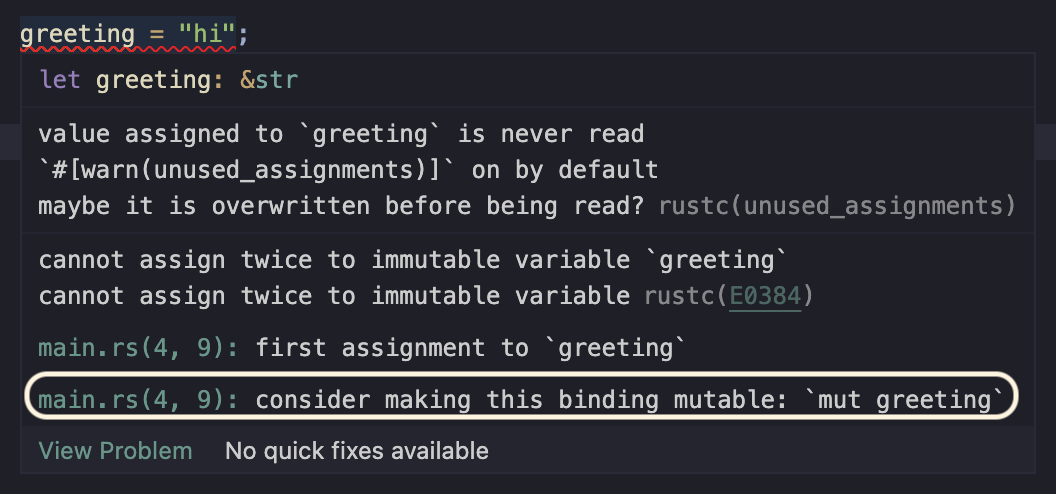
Notice that in this diagnostic it even includes a possible way to fix it. This
is similar to what we saw up above with the stubs for Scala, but wait, there's a
bonus here. If you click the link to go to where the first assignment of
greeting is you'll notice there's a quickfix attatched to the position that
will actually just fix it for you by adding a mut.
There is a common pattern you'll see in some languages like Scala where the compiler knows exactly a way to fix your problem, but doesn't expose this information in an structured way. You're always left with the information just in a string with other information. Rust seemingly does a great job at this by not only returning the information, but returning it in a structural way that tools and therefore users can benefit from.
Let's jump back to our scale. If we were to drop Rust on here I'd probably drop it much further to the right than Scala.
It's all about Structure
At this point hopefully you're wondering why this all is. Why doesn't Scala 3 have some of these niceties. The answer to this is sort of twofold. Firstly there's a mismatch in priority between compiler development speed (meaning those working on the compiler) vs the desired to have more structured output. It's all about structure, and I'll show you why.
Up above we went through the full flow and structure of a Dotty diagnostic. Let's now look at the structure of a Rust one and compare. The core Diagnostic can be found here in json.rs
struct Diagnostic {
    /// The primary error message.
    message: String,
    code: Option<DiagnosticCode>,
    /// "error: internal compiler error", "error", "warning", "note", "help".
    level: &'static str,
    spans: Vec<DiagnosticSpan>,
    /// Associated diagnostic messages.
    children: Vec<Diagnostic>,
    /// The message as rustc would render it.
    rendered: Option<String>,
}
This looks pretty familiar and more or less what you'd expect. Note that we do
have a possible DiagnosticCode here that is getting forward, so let's look at
what that looks like:
struct DiagnosticCode {
    /// The code itself.
    code: String,
    /// An explanation for the code.
    explanation: Option<&'static str>,
}
This looks strangely similar to the LSP one! I'll also again bring up the Rust Error index that has a full listing of the Diagnostics that are reported by Rust, with explanations, and runnable code samples.
But let's keep going because there are some more things in the Diagnostic
which are new to use. The next one is the
DiagnosticSpan:
struct DiagnosticSpan {
    file_name: String,
    byte_start: u32,
    byte_end: u32,
    /// 1-based.
    line_start: usize,
    line_end: usize,
    /// 1-based, character offset.
    column_start: usize,
    column_end: usize,
    /// Is this a "primary" span -- meaning the point, or one of the points,
    /// where the error occurred?
    is_primary: bool,
    /// Source text from the start of line_start to the end of line_end.
    text: Vec<DiagnosticSpanLine>,
    /// Label that should be placed at this location (if any)
    label: Option<String>,
    /// If we are suggesting a replacement, this will contain text
    /// that should be sliced in atop this span.
    suggested_replacement: Option<String>,
    /// If the suggestion is approximate
    suggestion_applicability: Option<Applicability>,
    /// Macro invocations that created the code at this span, if any.
    expansion: Option<Box<DiagnosticSpanMacroExpansion>>,
}
Some of this is familiar, but we do have some new interesting things. Most
interesting to me is the suggested_replacement. Remember earlier when we
talked about the compiler knowing how to actually fix this at times and maybe
putting it into the message. Here's a great example of how this could be
returned structurally. You'll also see there is a suggestion_applicability
that explains the "confidence" in the correctness of the suggestion. I'll make a
note here that this isn't just Rust doing this. This goes back way further.
For example we can look at Fix-it hints from Clang. Here is a snippet from the
Clang docs:
"Fix-it" hints provide advice for fixing small, localized problems in source code. When Clang produces a diagnostic about a particular problem that it can work around (e.g., non-standard or redundant syntax, missing keywords, common mistakes, etc.), it may also provide specific guidance in the form of a code transformation to correct the problem.
Note that in the DiagnosticSpan there is also is_primary in order to
indicate if one span is the "primary" span or not. This is helpful when
reporting multiple different diagnostic spans tied to one diagnostic.
Finally take note that in the Diagnostic there is another new field,
children. This children shows that a single Diagnostic can also hold other
diagnostics. Another thing that is currently unrepresentable in Dotty.
Why did you even look into this?
At this point you may be wondering why? What got you focused on this? So join me in going back a while and looking at a real-world tooling use-case that starting me down this path of exploring what diagnostics actually look like in Dotty, and then coming to the realization that we can do much better. Back in early 2021 Gabriele Petronella sent in a PR to Metals to take an error from the compiler about a missing import and create a Code Action out of it. This code action feature is the same type of feature you saw up above with Rust and the Quick Fix example. During this process this comment is what sparked it for me:
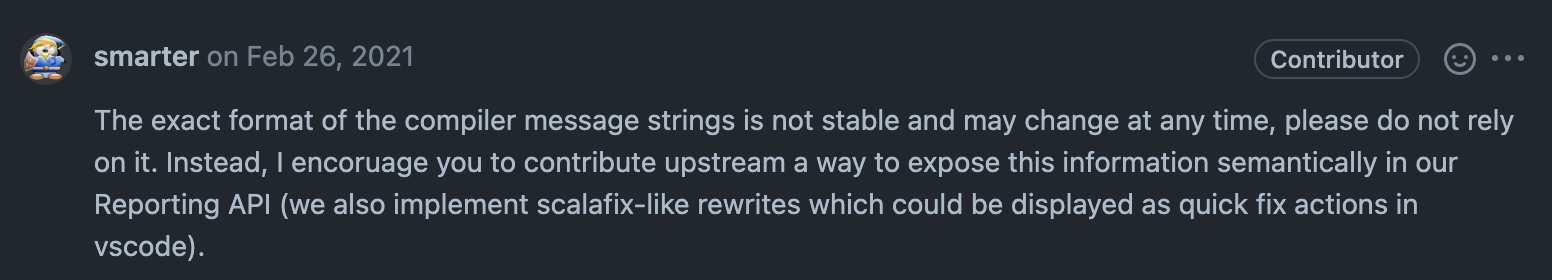
The main issue here is that in Metals in order to offer certain Code Actions we need to first recognize what type of diagnostic is being reported. As you saw earlier, there is a unique ID, but it's not forwarded at all. So we do things like this:
object TypeMismatch {
  private val regexStart = """type mismatch;""".r
  private val regexMiddle = """(F|f)ound\s*: (.*)""".r
  private val regexEnd = """(R|r)equired: (.*)""".r

  def unapply(d: l.Diagnostic): Option[(String, l.Diagnostic)] = {
    d.getMessage().split("\n").map(_.trim()) match {
      /* Scala 3:
       * Found:    ("" : String)
       * Required: Int
       */
      case Array(regexMiddle(_, toType), regexEnd(_, _)) =>
        Some((toType.trim(), d))
      /* Scala 2:
       * type mismatch;
       * found   : Int(122)
       * required: String
       */
      case Array(regexStart(), regexMiddle(_, toType), regexEnd(_, _)) =>
        Some((toType.trim(), d))
      case _ =>
        None
    }
  }
}
This recognizes situations where maybe you changed a method and now the explicit return type doesn't fit. So it offers you a code action to quickly change the return type to the new expected type. Now this probably seems a bit crazy, but when you have nothing but a string to work with, tooling is left to do gross things like this. Hacks like this are flaky and error-prone not only because they are regex, but because error messages can change. Imagine how much easier it'd be if we had access to a unique ID to know what type of diagnostic we were dealing with. We could rid tooling of these types of hacks. Now imagine if they even came with a suggested fix! Crazy talk.
What work is being done to improve this?
The good news is that there has been some progress made in this area. Up
above we saw the
structures that were used all the way from the Dotty compiler to your editor.
These were a bit older since in recent months they've changed slightly. For
example the new Problem.java got a couple new fields:
/**
 * The unique code attached to the diagnostic being reported.
 *
 * <p>NOTE: To avoid breaking compatibility we provide a default to account for older Scala
 * versions that do not have codes.
 */
default Optional<DiagnosticCode> diagnosticCode() {
  return Optional.empty();
}

/**
 * The possible releated information for the diagnostic being reported.
 *
 * <p>NOTE: To avoid breaking compatibility we provide a default to account for older Scala
 * versions that do not have the concept of "related information".
 */
default List<DiagnosticRelatedInformation> diagnosticRelatedInformation() {
  return Collections.emptyList();
}
We now have the ability to have a DiagnosticCode just like we saw in Rust and
also the ability to nest diagnostics with the new
DiagnosticRelatedInformation. This is great, but it also took a crazy amount
of changes just to get the code forwarded all the way to the editor. Take a
look:
- In sbt (and zinc) - https://github.com/sbt/sbt/pull/6874
- In Dotty - https://github.com/lampepfl/dotty/pull/14965
- More Dotty - https://github.com/lampepfl/dotty/pull/15728
- Changes in BSP - https://github.com/build-server-protocol/build-server-protocol/pull/320
- In sbt (server) - https://github.com/sbt/sbt/pull/6998
- In Bloop - https://github.com/scalacenter/bloop/pull/1750
- In Mill - https://github.com/sbt/sbt/pull/6874
- In Metals - https://github.com/scalameta/metals/pull/4239
All of this just to get a single thing reported. Here it is, in all of its glory:
"diagnostics": [
  {
    "range": {
      "start": {
        "line": 9,
        "character": 15
      },
      "end": {
        "line": 9,
        "character": 19
      }
    },
    "severity": 1,
    "code": "7",
    "source": "sbt",
    "message": "Found:    (\u001b[32m\"hi\"\u001b[0m : String)\nRequired: Int\n\nThe following import might make progress towards fixing the problem:\n\n  import sourcecode.Text.generate\n\n"
  }
],
There are some other tools in the ecosystem that are starting to jump on board
with this idea of diagnostics that can just include a fix. For example
scala-cli has one that was somewhat recently added to metals by
@lwronski that given a using lib directive that is out of date,
scala-cli will actually provide a diagnostic not only notifying the user that
it's out of date, but offering a quick fix to update it to the latest:
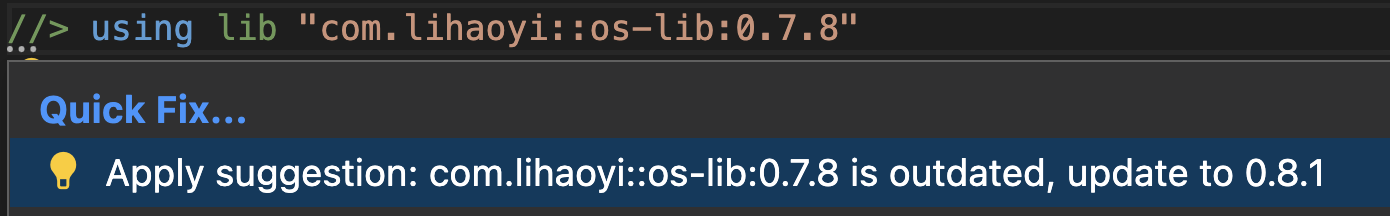
This is a killer feature that I wish more tools would offer, especially the compiler. If you're curious under the hood what the diagnostic for this look like, here you go:
"diagnostics": [
    {
      "range": {
        "start": {
          "line": 0,
          "character": 15
        },
        "end": {
          "line": 0,
          "character": 40
        }
      },
      "severity": 4,
      "source": "scala-cli",
      "message": "com.lihaoyi::os-lib:0.7.8 is outdated, update to 0.8.1\n     com.lihaoyi::os-lib:0.7.8 -\u003e com.lihaoyi::os-lib:0.8.1",
      "data": {
        "range": {
          "start": {
            "line": 0,
            "character": 15
          },
          "end": {
            "line": 0,
            "character": 40
          }
        },
        "newText": "com.lihaoyi::os-lib:0.8.1"
      }
    }
  ],
What we could have
Let's revisit one of the example we had up above.
trait Foo:
  def hello(): Unit
  def goodBye(): Unit

class Greeting extends Foo
The actual diagnostic structure you end up getting from your build server about this looks like this:
"diagnostics": [
    {
      "range": {
        "start": {
          "line": 11,
          "character": 6
        },
        "end": {
          "line": 11,
          "character": 14
        }
      },
      "severity": 1,
      "source": "bloop",
      "message": "class Greeting needs to be abstract, since:\nit has 2 unimplemented members.\n/** As seen from class Greeting, the missing signatures are as follows.\n *  For convenience, these are usable as stub implementations.\n */\n  def goodBye(): Unit \u003d ???\n  def hello(): Unit \u003d ???\n"
    }
  ]
But what if instead of just the message containing all this information the
error reported from the compiler looked like this:
"diagnostics": [
    {
      "range": {
        "start": { ... },
        "end": { ... }
      },
      "severity": 1,
      "code": "034",
      "source": "dotty",
      "message": "class Greeting needs to be abstract, since:\nit has 2 unimplemented members.\n/** As seen from class Greeting, the missing signatures are as follows.\n *  For convenience, these are usable as stub implementations.\n */\n",
      "data": {
        "range": {
          "start": { ... },
          "end": { ... }
        },
        "newText": "def goodBye(): Unit \u003d ???\n  def hello(): Unit \u003d ???\n"
      }
    }
  ]
Imagine just being able to click a quick fix and get these stubs automatically without needing to manually copy anything.
Remember the Rust error index? What if we had something like this for Scala? Something that was searchable, had examples, and was easy to use? With the recent obsession with newcomers in Scala 3 I'm quite surprised that this doesn't exist. If you're curious about what this could look like, I actually have a WIP version of one in ckipp01/dotty-error-index. Please feel free to contribute!
Also remember the diagnostic example we showed from Dotty that had inlined code
in another box below the main message? What if we used
diagnosticRelatedInformation for this instead. By doing that we'd
automatically get extra navigation possibilities in editors like VS Code. Here
is an example showing that:
What's keeping this from happening?
I slightly touched on this up above in the It's All About Structure section, but I believe the major things preventing some of this from happening are twofold.
Firstly, the compiler team has to actually buy into this idea. While I can say from experience that some totally have! But I can also say that some totally haven't. There was a big push like 6 years ago to add missing error message IDs and to have stable identifiers for each message. I commend this effort so early on. It made very slow progress for a while until in 2020 it was abruptly stopped:
The architecture for errors described in this issue proved to be heavy and impractical. The migration process frequently interferes with in-flight PRs and the benefits are marginal. We should find a more light-weight way to represent errors.
This same mindset is seemingly still around where the idea of forcing stable identifiers here is a chore and not worth the effort. You can see some conversations around this in various places like here.
While you can make the argument early on that pushing for stable identifiers like this may have slightly hindered the speed of getting things merged in, this mindset is also putting structured diagnostic reporting as a hindsight instead of something baked right into the language. It's a shame that while the error messages themselves have greatly improved in Scala 3, the structures is essentially identical to what it's been for as long Scala has been around. That's maybe alright for a research language, but it doesn't cut it in the industry where developers are expecting a level of help and structure that they get with languages like Rust.
I mentioned early in the articles that the most common way you'll see an error reported in Scala 3 is simply by taking a string and a position and reporting it like so:
if (param.is(Erased))
  report.error("value class first parameter cannot be `erased`", param.srcPos)
else
  for (p <- params if !p.is(Erased))
    report.error("value class can only have one non `erased` parameter", p.srcPos)
While this is by far the quickest way to report, it's only good for that. Under
the hood it creates a -1 error code, which leaves us with an unusable error
ID. There needs to be a push to force stable identifies and care taken to ensure
unique error ids don't just disappear in favor of this style of
reporting.
The second main blocker here is simply having someone focus and work on it.
While it's easy to point to the community and say, "someone just needs to step
up and do it", changes like introducing diagnosticRelatedInformation require
a decent amount of refactoring, primarily due to this trying to be hacked in
after the fact instead of being baked into reporting from the start. So
knowledge of the actual compiler internals are necessary for this. Thankfully
there are ongoing efforts like the Scala 3 Compiler Academy
and also people like @smarter that seem behind this idea and are
willing to help. This is incredibly important as without support from the actual
compiler team, there's no way this will get into the compiler.
Conclusion
If you made it this far, bravo! I'm hoping that you now have a bit more clarity on what makes up a diagnostic, how that diagnostic gets to your editor when using the tooling chain we outlined above, and also an eagerness to see more structured and actionable diagnostics coming from the compiler. The entire ecosystem will benefit from this, from newcomers to experts alike. If you'd like to follow along with the ongoing work in this area, you can follow the Progress Issue about this in the Dotty repo.
Cheers, and thanks for following along.